El Niño Explained: Causes, Global Impacts, and Future Risks
El Niño is one of the most powerful forces in Earth’s climate system. Every few years, it changes rainfall, shifts storm tracks, and disrupts ecosystems across the globe. Although it begins in the Pacific Ocean, its consequences reach almost every continent. Therefore, understanding El Niño is essential for predicting global weather and preparing for climate risks.
What Is El Niño?
El Niño is a recurring climate event that usually appears every three to five years. It starts in the tropical Pacific Ocean, but its impact spreads worldwide.
Centuries ago, fishermen in Peru noticed the phenomenon. Around Christmas, the ocean warmed, and fish stocks disappeared. They called it El Niño, meaning “the Christ Child.” Since then, scientists have identified it as part of the El Niño–Southern Oscillation (ENSO) cycle.
This cycle has three phases. El Niño is the warm phase. La Niña is the cool phase. Neutral conditions lie in between. Each phase alters the way oceans and atmosphere interact. As a result, global weather patterns shift dramatically.
How Does El Niño Form?
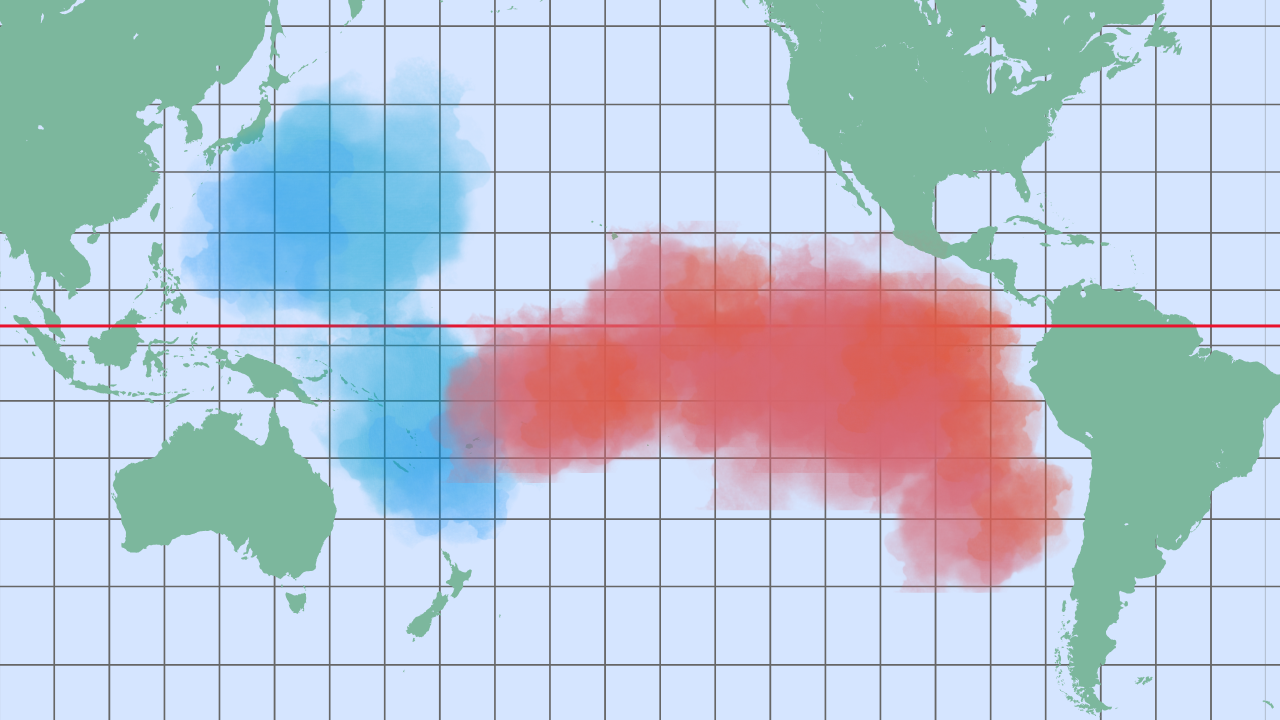
Under normal conditions, strong trade winds push warm surface waters westward. This allows cold, nutrient-rich water to rise near Peru and Ecuador. The process, called upwelling, supports marine life and stabilizes weather. During El Niño, however, those trade winds weaken or even reverse. Warm surface water then flows eastward across the Pacific. As a result, it builds up in the central and eastern Pacific and raises sea temperatures by several degrees.
This shift disrupts more than just the oceans. Upwelling stops, which starves fisheries and marine ecosystems. In addition, warmer water heats the air above it. That change alters rainfall, causing storms in normally dry regions and droughts in places that usually receive heavy rain.
Global Impacts of El Niño
El Niño’s effects extend far beyond the Pacific. In fact, they create a chain reaction that touches nearly every region on Earth.
Asia and Australia
In Asia and Australia, El Niño often triggers drought. Rivers shrink, farmland dries out, and wildfires become more intense. For example, Indonesia experienced catastrophic forest fires in both 1997 and 2015, largely fueled by El Niño conditions.
South America
On the eastern side of the Pacific, the impact is the opposite. Peru and Ecuador, which are usually dry, suddenly experience heavy rainfall. As a result, storms trigger floods and mudslides that damage homes, farmland, and infrastructure.
Farther inland, northern Brazil and the Amazon often face drought. In contrast, southern Brazil, Argentina, and Uruguay usually receive excessive rainfall. Consequently, these countries deal with widespread flooding and economic losses.
Africa and the Oceans
El Niño also affects Africa. In eastern Africa, countries such as Kenya and Tanzania often experience heavy rains. Therefore, floods can spread disease and disrupt communities. However, southern Africa usually suffers from drought. Millions of people then risk food shortages and crop failure.
The oceans themselves change as well. Cold-water upwelling shuts down off South America, starving fish populations. Anchovy and sardine stocks collapse, which harms sea lions and seabirds. In addition, warm waters stress coral reefs. As a result, coral bleaching occurs in fragile ecosystems such as the Great Barrier Reef.
El Niño and the United States
The United States also experiences major impacts from El Niño, especially in winter. The Pacific jet stream shifts southward, redirecting storms into new areas.
California often receives heavy rainfall. Strong El Niño years such as 1997–98 and 2015–16 brought record floods and mudslides. In addition, Texas, Louisiana, and Florida tend to face wetter winters with more frequent storms.
In contrast, the Pacific Northwest usually becomes warmer and drier. This leads to reduced snowpack and threatens water supplies. The Midwest shows more variation. Some years bring welcome rain, while others cause damaging frost. Therefore, El Niño keeps farmers uncertain about their harvests.
El Niño also influences hurricanes. In the Atlantic, stronger upper winds suppress hurricane formation. As a result, the East Coast and Gulf of Mexico often see fewer and weaker hurricanes. However, the opposite happens in the Pacific. There, El Niño fuels more tropical storms, some of which bring late-season rain into the U.S. Southwest.
How Scientists Predict El Niño
Modern science makes it possible to forecast El Niño months ahead. Scientists use anchored buoys across the Pacific that measure temperatures, currents, and winds. Satellites add more data about clouds and rainfall.
When warm water appears in the central and eastern Pacific, researchers pay close attention. If trade winds weaken and storms shift eastward, the signs become clear. As a result, computer models can simulate how El Niño will develop. Agencies such as NOAA in the United States, BoM in Australia, and ECMWF in Europe run these forecasts regularly.
However, predicting El Niño is not easy. The so-called “spring barrier” makes forecasts in March and April less reliable. Small ocean changes can alter the outcome. Even so, improved technology now allows warnings three to six months in advance. Consequently, governments, farmers, and disaster planners have more time to prepare.
El Niño in a Warming World
Scientists increasingly ask whether climate change is making El Niño worse. Evidence suggests that it is.
Warmer oceans provide more fuel for El Niño. Strong events are becoming more intense, and their effects are amplified by higher global temperatures. For example, the 2015–16 El Niño helped make 2016 the hottest year ever recorded at the time. Coral reefs bleached, crops failed, and over 60 million people were affected worldwide.
In addition, even La Niña years, which normally cool the planet, now rank among the warmest years recorded. This shows how climate change raises the baseline for all events. Therefore, the next strong El Niño may again set new global heat records.
So, El Niño is not just a weather event. It is a global climate driver that affects rainfall, temperature, ecosystems, and economies.
In a warming world, its effects may grow even stronger. However, thanks to better monitoring and prediction, societies now have tools to prepare. Therefore, studying El Niño is essential for protecting lives, securing food supplies, and reducing damage.
Understanding El Niño is a key step in adapting to climate change.
Question you can anwser now:
What is El Niño?
How does El Niño form in the Pacific Ocean?
How does El Niño impact Asia, South America, and Africa?
How does El Niño affect marine life and oceans?
How does El Niño change weather in the United States?
How does El Niño affect hurricanes in the Atlantic and Pacific?
Thousands of miles of emptiness. Nothing but blue, grey, green and white. Giant waves, shrieking gales, water so cold. This is what millions of people in history had to cross in order to begin new...
Oceanography – the nature of the vast oceans and their ecosystems. The largest of the world’s biomes is the one we know the least of. Crushing pressures and the vast extent of the abyssal...
Coral Reefs, seaweed, kelp and plankton. Just a handful of lifeforms that we find in waters where light can reach, where plankton can photosynthesise, and for a complex array of plants and animals to...
What Is the Köppen Climate Classification System? Global Zones Made Simple
What Is the Köppen System and Why It Matters
The Köppen Climate Classification System is a globally recognized method for categorizing different climate types. It uses two basic measurements: average temperature and average precipitation. By analyzing these, the system groups Earth’s climates into clear, understandable categories.
This framework was first introduced by Wladimir Köppen, a German climatologist, and later refined by Rudolf Geiger. Together, they transformed a complex set of climate data into a practical tool. Today, it’s widely used in education, agriculture, urban planning, and climate science.
What makes the Köppen system so powerful is its balance between scientific precision and usability. It offers a quick way to understand global weather patterns without needing complex tools. Whether you are a student, researcher, or policymaker, the Köppen system gives you an easy way to interpret climate data and apply it to real-world problems.
Why We Classify Climate: Purpose and Benefits
Classifying climates serves many purposes. Humans have always tried to categorize nature—from plants and animals to minerals and landscapes. When we classify climate, we turn weather patterns into something organized and predictable.
This system helps us make informed decisions. For example, farmers use it to choose crops suited to their region. City planners use it to design buildings that withstand local weather. Scientists study it to track climate change over time.
But there’s more than just practical value. Classifying climate zones also helps us understand how climate affects culture, biodiversity, and even human migration. By comparing different climate regions, we can appreciate how environments shape societies and ecosystems in unique ways.
Global Climate Zones from Equator to Poles
The Köppen system divides the world into five major climate groups, labeled with the letters A through E. These categories reflect the global pattern of temperature and precipitation from the equator to the poles.
Each group is broken down into subtypes, which add detail by describing seasonal rainfall patterns and temperature differences. This results in letter combinations like Csa or Dfb, which at first seem complex but actually provide a compact summary of a region’s climate.
By learning the meaning behind each letter, you can quickly identify what kind of weather to expect in any part of the world. This structure makes the Köppen system both easy to use and widely applicable in fields like education, meteorology, and environmental planning.
Group A: Tropical Climates
Tropical climates are found near the equator, where temperatures stay high throughout the year. These regions also receive abundant rainfall, supporting lush vegetation and rich biodiversity.
Af (Tropical rainforest): These areas experience heavy rainfall every month. The climate supports dense forests with tall trees, vines, and a variety of wildlife.
Am (Tropical monsoon): This subtype has a short dry season followed by intense rain. Monsoons dramatically affect agriculture and daily life in these regions.
Aw/As (Tropical savanna): Here, rainfall is seasonal. Wet and dry periods alternate, leading to landscapes with a mix of grasslands and scattered trees.
Tropical regions are often home to high population densities due to their fertile land and predictable seasons. However, they’re also vulnerable to flooding and drought, depending on yearly climate fluctuations.
Group B: Dry Climates
Dry climates are defined by a lack of rainfall. In these zones, evaporation exceeds precipitation, making water a scarce and precious resource.
BWh (Hot desert): Found in places like the Sahara, these areas are extremely hot during the day and cold at night. The landscape is mostly bare, with little vegetation.
BWk (Cold desert): These regions are dry but colder, often located at high elevations or inland. They have more seasonal variation and occasional winter frost.
BSh/BSk (Semi-arid): These areas receive slightly more rain, allowing for grasses and small shrubs to survive. They often serve as transition zones between deserts and more temperate areas.
People living in dry climates often rely on irrigation, water conservation, and climate-adaptive crops. These adaptations show how societies can thrive even under challenging environmental conditions.
Group C: Temperate Climates
Temperate zones offer moderate weather with clearly defined seasons. These areas typically have warm summers and cool winters, with rainfall spread throughout the year or focused in certain seasons.
Csa/Csb (Mediterranean): These climates are known for dry summers and wet winters. Common in southern Europe and coastal California, they support crops like olives, grapes, and wheat.
Cfa (Humid subtropical): Found in places like the southeastern United States, this subtype has hot, humid summers and year-round rainfall. It supports dense forests and is ideal for agriculture.
Cfb/Cfc (Oceanic): These climates feature mild temperatures all year and frequent rain. Coastal regions in western Europe often have this climate, creating green, fertile landscapes.
Temperate zones are often densely populated due to their favorable living conditions, long growing seasons, and steady access to water.
Group D: Continental Climates
Continental climates occur inland, where the ocean’s moderating effect is absent. This results in more extreme seasonal changes—hot summers and very cold winters.
Dfa/Dfb: These climates feature year-round precipitation, with summers that range from warm to hot, and winters that can bring heavy snow and freezing temperatures.
Dfc/Dfd (Subarctic): Found in Canada and Siberia, these areas endure long, bitterly cold winters and short, mild summers. The vegetation is mainly coniferous forest.
Living in continental climates requires careful planning. Buildings need strong insulation, and people often grow crops during short summer windows and store food for the long winters.
Group E: Polar Climates
Polar climates are the coldest on Earth, with very low temperatures and little to no precipitation.
ET (Tundra): These regions have brief summers where temperatures rise just above freezing. Small plants like mosses and grasses grow during this window.
EF (Ice cap): Found in Antarctica and parts of Greenland, these areas remain below freezing all year. No vegetation survives, and life is extremely limited.
These climates are important to climate research because they are highly sensitive to global warming. Even small temperature increases can lead to melting ice and rising sea levels, impacting the entire planet.
How Köppen Codes Work: A Simple System With Big Value
Each Köppen code is like a shortcut that describes a region’s climate. The structure includes:
First letter (A–E): Main climate group
Second letter: Seasonal rainfall pattern
Third letter (optional): Temperature variation
For example:
Csa: Hot-summer Mediterranean climate
Dfb: Humid continental with warm summers and cold winters
These codes are useful because they condense complex data into an easy format. They’re used in textbooks, climate reports, and even weather apps to describe climates at a glance.
Real-World Uses: Why the Köppen System Still Matters
The Köppen system isn’t just for scientists—it has everyday applications. Teachers use it to explain global climates. Farmers use it to select the best crops. City planners refer to it when designing buildings suited for local weather.
As the climate changes, Köppen zones help track shifts in temperature and rainfall. For example, some areas once classified as temperate are becoming more dry. This has major implications for agriculture, biodiversity, and water management. By using this system, we can monitor trends, adapt to changes, and make informed decisions that benefit both people and the planet.
Conclusion
The Köppen Climate Classification System turns global weather into a clear, understandable structure. From tropical rainforests to polar ice caps, each code tells a story about temperature, rainfall, and life. Whether you’re studying geography or planning a city, this system gives you the tools to understand climate—and respond to it—with confidence.
The 2025 monsoon is shifting from southwest to northeast after one of the wettest seasons in years. Discover why it was so intense and what comes next...
When floods or other natural disasters occur, every minute matters. Today, rescue teams have eyes from above, using satellite imagery, drones, or helicopters. As a result, they get a clear picture of...
The Amazon Rainforest: Its Past, Present, and Future https://www.youtube.com/watch?v=OcI1FlQOu54 The Amazon Rainforest. Raw, wild and absolutely essential to life as we know it. It is one of the most...
The Pacific North West of the United States and Canada. A wonderland of nature. Epic scenery – breath-taking mountains, endless forests, windswept beaches, even volcanoes. And amazing cities that have influenced the wider world far beyond their isolated patch along the wild Pacific coast. And… it is somewhat well known for its weather too. Dominated by wet winter westerlies blowing in from the Pacific each year, its exposed coasts feature some of the highest rainfall in the world, and sport temperate rainforests.
So when I briefly touched on this region in my Secrets of World Climate Series in the Mediterranean chapter, it created some controversy. “No way that’s Mediterranean! It’s Oceanic, Maritime West Coast, like Britain and Ireland!” And, like so many others, I have to confess, I had thought the same before I did my research into that series. So I thought I should devote an article to the Curious Case of The Pacific Northwest Climate, in this, the first of the cases, in my Climate Casebook.
Location of the principal cities of the Pacific Northwest
So the wet winters of the Pacific NW are pretty well known. It’s also fairly well known that Vancouver has the mildest of all winters out of all the Canadian cities. But much fewer people know about the summers in this area.
Having lived, myself, for many years in the Mediterranean climate of Southern California and South Australia, and the Oceanic climate of Britain, I have a very strong understanding of these two climate zones borne of direct experience backed by my own research. Yes, it’s undoubtedly obvious to anyone who knows a little of geography, that those Mediterranean areas are significantly warmer than Britain, both in winter and summer. That’s one distinction. The other, still fairly well known distinction is that those Mediterranean areas have dry summers. For most of the years I lived there, I could remember most summers where it did not rain for 4, 5 or even 6 months at all. To go without rain for even one month in Britain at any time of year is unusual, which was what made the British summer of 2018, where it was sunny every day and without rain for two months, all the more remarkable.
Britain is famous for its rain, very much so, in fact. And because Seattle, Portland and Vancouver are too, and because they lie at a similar latitude facing west to an ocean, the assumption is that they must have the same climate. An assumption I also once made.
But the truth is that the Pacific NW climate is actually a hybrid of these two climates I have lived under. It has very similar winter and summer temperatures to England, but it has the wet winter and dry summer patterns of California. Oceanic temperatures meets Mediterranean rainfall patterns.
Compared to the dodgy summers of Britain, Pacific NW summers are consistently glorious affairs. Low rainfall and high sunshine hours are the norm.
Let’s start with temperature and rainfall by comparing the three main cities of the Pacific Northwest with those of Los Angeles and London. As can be seen, the Pacific NW has very similar temperatures to London, with Portland in the south being slightly warmer, and Vancouver in the north being slightly cooler. LA is hotter than all the others year round – no surprises there.
But when it comes to rainfall, here is where the eyebrows start to raise. All three Pacific Northwest cities experience less rain than London during the summer, but much heavier rain during the winter. London’s rain is consistent throughout the year, and incidentally is drier overall. London has the classic Oceanic year-round rain pattern, whereas the Pacific Northwest has distinctly wetter winters and drier summers, consistent with a Mediterranean climate like Los Angeles, albeit wetter.
Climate Graphs of Pacific Northwest cities in comparison to classic Oceanic London and Hot Summer Mediterranean Los Angeles
Comparison of sunshine hours
Equally telling is this graph comparing these same cities’ monthly sunshine hours. All three Pacific Northwest cities experience similarly low sunshine hours to London in winter, but in summer, clearer skies result in sunshine hours that are closer to that of Los Angeles, which is well known for being one of the sunniest cities in the world. In general we can see that there is a dramatic seasonal variation in sunshine in the Pacific Northwest, compared to the consistently sunny LA, and sadly rather dreary London.
This climate type was actually known to Vladimir Koppen, and he designated this type with the letters Csb – C for mild temperatures, s for dry summer, b for warm summer. It shares two letters with Los Angeles Csa, and two letters with London’s Cfb, and so, it really is a hybrid of the two.
The Pacific Northwest Climate is a hybrid of Oceanic and Hot Summer Mediterranean climates
A detailed map of Koppen zones in the region, courtesy of Adam Peterson
Mediterranean climate zones across the world include the Pacific Northwest
That’s not to say the whole region comes under this climate zone. Parts of the coast have so much rain, with some falling throughout the year, that they are in fact Oceanic, although with still a noticeable winter-summer rainfall contrast. Vancouver also fits this bill, and is on the border of Oceanic Cfb and Warm Summer Mediterranean Csb.
Ok, so the climate data doesn’t lie. The question is why does this only occur in the Pacific NW? Well, actually it does occur in a few other places of the world, such as northern Portugal, southern Chile and the coast between Adelaide and Melbourne in Australia. But these other areas are either relatively underpopulated or don’t have the global reach that the Pacific NW hubs do, so their stories of similar heavy winter rains yet warm dry and sunny summers have gone unnoticed, drowned out by the much larger and well known Csa zones of the classic Mediterranean.
Lashed by storm after storm from the Pacific in the winter, known locally as “The Pineapple Express”, the Cascade and Rocky Mountains further accentuate this rainfall from the west, dumping it on the coastal cities that lie on the western slopes. These same mountains blocks humid subtropical and continental air from bringing rains in the summer, influencing the Pacific NW high pressure to dominate the area during summer, guaranteeing relatively dry weather.
Winters see regular storms moving in off the Pacific Ocean bringing plenty of rain
In the summer, the Rockies prevent Humid Subtropical air from the east moving into the whole of the Western United States
High pressure dominates, bringing fine weather for most of the summer
And so we get very wet winters reminiscent of the Scottish and Irish coasts winter, but then summers almost as dry as those of California. It’s a bit schizoid, a cross-breed, a mongrel of a climate. But talk to the locals and they love it. Well, the summers at least. Opinion is still divided on the winters…
It’s the world’s largest weather system. Affecting almost half of the world’s population, its seasonal changes in winds and rain determine the cycles of nature and humankind, year after year. It is the story of the world’s largest continent, fighting with two oceans, played out in the atmosphere above. From the blistering heat of India, to the frigid north of Siberia, this is the Asian Monsoon.
No discussion of Earth’s climate can go without some mention of the largest single pattern of weather on the globe. Because the Asian Monsoon covers so many individual climate zones, there was no room to give it a good treatment in any of the various chapters that covered Asia in my Secrets of World Climate series. And so it gets an chapter of its own in my Climate Casebook.
Etymology
To begin our understanding of this enormous weather system, we should start at the beginning, and the word itself. Monsoon comes through Portuguese monção from the original Arabic word mawsim, which means “season / change in wind direction”. You see, the Asian Monsoon even affects Arabia, even though that change in wind direction results in nothing yielding rain. A monsoon is, in its simplest form, always a change in wind direction, but in the case of the Asian Monsoon, this change in wind direction occurs around the whole of one side of the world’s largest continent, producing a wet summer and dry winter across a huge area of Earth.
Winds in summer bring moist ocean winds and rain onto Asia
Winds in winter bring dry continental winds
Geographic Extent
Now those of you familiar with tropical climates will know something of wet and dry seasons, and how the trade winds of the tropics determine these. I covered this in my chapter on Tropical Wet and Dry Climates in my other series. They always occur within the tropics of Cancer and Capricorn, from 23°N to 23°C south. So wet and dry seasons related to changing wind direction are not unique to Asia. What makes the Asian Monsoon stand out are two things – the great intensity of the wet season in the Indian Subcontinent and the extension of the wet and dry season pattern in Eastern Asia way beyond the tropics into the temperate, continental and subarctic latitudes.
So the Asian Monsoon has these two notable aspects, and each defines the two broad halves of the monsoon.
The intense monsoon that affects India and Bangladesh is the most well known, and it determines the lives of the one and a half billion people that live there, more heavily than any other weather system in the world. The economic fortunes, even the survival itself, of these populations depends upon the timing and severity of the wet season that washes over these lands between June and September.
The two broad subdivisions of the Asian Monsoon
Less well known is the East Asian Monsoon. Though less intense, its range is much more extensive, and as many people experience its annual rhythm, with Eastern Russia, Mongolia, Korea, Japan, Taiwan and most of China affected.
Dynamics – The Annual Movement of the ITCZ
Before we look at these areas in more detail, we should try to understand what dynamics are special to the Asian Monsoon. This weather system and its causes are complex and even to this day are not fully understood. However it is generally accepted that the two strongest influences are the seasonal march of the doldrums above and below the equator that affects all tropical wet and dry climates, magnified by the seasonal heating and cooling of the giant Asian landmass.
The doldrums, also called the Intertropical Convergence Zone, or ITCZ, is the band of low pressure around the tropics where heating from the sun causes upward convection of hot air leading to a drawing in of air from the surrounding land or sea in the form of trade winds. As the global seasons alternate summer between the northern and southern hemispheres, the ITCZ follows, with it tracking north in the northern summer, and then south in the southern summer. This band is almost always accompanied by heavy thunderstorms and consequential rainfall as the hot and moist air is unstably thrust into the cold upper atmosphere.
The Doldrums (ITCZ) in July bring low pressure and storms to Asia
The Doldrums (ITCZ) and its storms are in the southern hemisphere in January so conditions in Asia are generally dry
Summer Monsoon
In the northern summer the ITCZ moves up into India and China, bringing with it southerly trade winds which blow onto the continent from the surrounding seas. This is what brings the rain with the monsoon, as it does with any tropical wet season. But this effect is strengthened further by the presence of the large Tibetan plateau, the heating of which leads to a deepening of the low pressure, strengthening the monsoon over India far beyond a standard tropical wet season.
Additional summer heating of the central Asian land mass north of Tibet, far from the moderating ocean, is also strong, and extends as far as Siberia, leading to winds blowing in from the Pacific across all of Eastern Asia from Hong Kong to the Russian Pacific coast. This is the only part of the world where summer peaks in rainfall occur in the mid to high latitudes and special climate zones, the Continental and Subarctic Monsoon types, were designated by Vladimir Koppen to account for this extension into the far north of what is essentially a tropical weather system.
In July, intense low pressure over the Tibetan plateau exists, further intensifying the pull of air off the Indian Ocean
The monsoon’s incredible reach, as seen in graphs of northern inland cities
The Asian Monsoon should not be confused with the Koppen Climate Zone ‘Tropical Monsoon’, which occurs throughout the tropics
The Asian Monsoon should not be confused with the Koppen Climate Zone ‘Tropical Monsoon’, which occurs throughout the tropics
Monsoon type climate zones extend way beyond the tropics into subarctic regions
Koppen Climate Zones, Winter Monsoon, Effect of Australia and Ocean Pressure Zones
While we’re on the subject of Koppen, we shouldn’t confuse the Koppen Climate type Am – the Tropical Monsoon, with the Asian Monsoon, as this zone can occur all over the tropics, from Miami and Rio in the Americas, to Central Africa, Indonesia and the Philippines. The Asian Monsoon encompasses a multitude of Koppen Climate zones, all of which have peak rainfall during the summer. These are Am – Tropical Monsoon, Aw – Tropical Savannah, Cwa – Subtropical Monsoon, Cwb – Subtropical Highland, Dwa/Dwb – Continental Monsoon, and Dwc/Dwd – Subarctic Monsoon.
So that is summer. But what about winter? Well, the opposite occurs. The ITCZ retreats back to below the equator while temperatures over Central Asia plummet below zero, leading to sinking, dense air and high pressure. This high pressure is the strongest on Earth and the continental winds that blow out from it to the oceans lead to dry winters across most of Asia. Only a few places, where such seasonal monsoon winds blow over water in both directions, receive rain or snow year round.
Extremely cold temperatures over Siberia in winter lead to sinking air…
… and very high pressure
So this, in essence, is the main mechanism driving the Asian Monsoon. There is more complexity to it of course. Australia is believed to have a strong influence on Asia, even though it is much smaller, because it acts as a pressure “counter-pole” – with Australian high pressure in the northern summer against the Asian low, and vice versa six months later. The Indian and Western Pacific oceans are the other “counter-poles” that either provide moist winds in the form of high pressure, or sink dry continental winds in the form of low pressure.
Low pressure over Australia…
… and the Indian and Pacific Oceans in January act as counterpoles to Asian high pressure and intensifying winds blowing out of the continent
High pressure over Australia…
… and the Indian and Pacific Oceans in July drive moist winds and heavy rain onto Asia
The monsoon’s growth in summer and retreat in winter can be seen in this composite of monthly average rainfall across the continent. It’s quite a mesmerizing animation, isn’t it? I could watch it for hours… Ok, moving on. Let’s now journey through the lands affected by the monsoon and examine how local topography and other factors leads to particular effects from one region to another.
Average rainfall throughout the month of January is low…
… compared to the deluge in summer
Arabia
The journey starts in the Arabian peninsula, with the origin of the word itself, but it’s also the westernmost point under the direct monsoon influence. In summer, winds blow towards the intense low pressure over Central Asia, but because these winds have travelled over the continent of Africa, they bring little to no rain. In winter, the winds switch direction, blowing out from the central Asian high, and once again are dry, continental winds. This is one reason why the Arabian peninsula is a desert.
Wind directions in Arabia in both January…
… and July come off the land and so are dry, leading to desert
Indian Subcontinent
Moving east into India, and the same wind directions, SW in summer, NE in winter, produces a dramatically different result. Now the SW summer winds blow over the warm Arabian Sea throughout the summer months, bringing in storm after storm that lashes the western coast of India from Kerala in the south to Gujarat in the north. All along this coast sits one edge of the Deccan plateau, and these moist winds are pushed upward and cooled, releasing their moisture in spectacular fashion as this graph of Mumbai shows.
The monsoon progresses across the Indian Subcontinent in stages, with the south receiving rains as early as late May, and the north as late as mid-July. Protected somewhat by the Deccan, much of the country experiences less severe monsoon rain. But where these strong, moisture-laden winds hit the Himalayas, they are thrust upward in a similar fashion to the west coast and dump almost all their moisture on the windward slopes. And with this mechanism, known as orographic lift, we come to a global superlative. The Indian Monsoon produces the wettest places in the world.
In July, ocean storms lash the Western coast of India bringing torrential rain
The arrival of the Indian Monsoon begins in the south as early as April…
… and heads north into May…
… and further again in June…
… until the whole subcontinent is wet by July
Being further inland, Delhi receives significantly less rain than Mumbai
Mawsynram and Cherrapunji, both in the Indian state of Meghalaya lie in the foothills of the Eastern Himalayas, and the world’s wettest title alternates from year to year between these two towns. Here’s the graph of Cherrapunji, with the scale kept at the standard used for all my charts, just so you can get your head around how much rain falls here. In one month alone at the peak of the summer monsoon, more rain falls here than in an entire year in Singapore, in the heart of the wet Tropical Rainforest, three times more rain than the annual total in rainy Vancouver, and six times more than the annual amount in supposedly rainy London. Such is the power of the monsoon.
‘Orographic Lift’ is the mechanism by which rain is produced from the uplift of air over terrain
The two rainiest places on Earth are in India, just north of Bangladesh
The summer rainfall of Cherrapunji is just mindboggling… and the annual total dwarfs other notably wet world cities
This graph of Lhasa in Tibet shows the effect of the Himalayas. Being sheltered from the full brunt of the monsoon behind the highest peaks of those mountains, including Everest, comparatively little rain gets through, although the mark of the monsoon is still clearly visible in the difference between winter and summer.
In the Indian winter, the dry NE wind blows from Central Asia out into the Indian Ocean, leading to completely dry conditions for months at a time, first with cool temperatures, and then very hot temperatures, which leads to the unique three seasons pattern of much of that country. A hot and wet rainy season, warm and dry “winter”, then very hot and dry “summer”.
Lhasa, behind the highest peaks of the Himalayas, experiences significantly less rain than India
In winter, dry winds blow across India from the heart of the continent
Such is the power of the monsoon, that changing wind directions changes the direction of ocean currents
Such is the strength and consistency of the seasonal monsoon winds, that they are even able to change the direction of an ocean current. A current’s direction is primarily determined by the winds blowing over it, so in summer, the around India flows east from Arabia to Myanmar, and in winter it flows west. So the name of this current alternates between the SW Monsoon Drift and the NE Monsoon Drift. This is the only major ocean current where such a reversal occurs every year. Such is the power of the monsoon.
China & Korea
Continuing further east, and we pass over South-East Asia. This area does feel the influence of the monsoon, but is within the normal latitudes where tropical wet and dry seasons occur, with Koppen types Am and Aw predominating, so does not require special mention in this article.
As we continue north and east, however, we enter Southern China, and the beginning of the Eastern Asian Monsoon. The interplay between continent and ocean now switches to the Pacific, and so we get a different character to that of the Indian – less intense, but spread out over a much greater area. The monsoon pushes inland hundreds of miles into the heart of China, subtropical in the south, continental in the north, and as one travels further north, the amount of rain, and the number of months in which it falls reduces, as the Pacific moisture is lost over the land carried by southerly winds.
Beijing, much further north than Hong Kong, is further from the ocean in terms of the summer monsoon winds, so sees much less rain
Seoul, South Korea, experiences a marked summer peak in rainfall as monsoon winds blow in from the south
Korea, like Northern China experiences the monsoon as a continental climate, with dry and cold winters blowing in from the Siberian High. But, being on the coast, the monsoon brings very wet summers, as this graph of Seoul shows.
Japan
Because Japan is an island archipelago, the change in wind direction produces rain or snow across all seasons, blowing in from the Pacific in summer and in winter, across the Sea of Japan that lies between this country and Russia. So one gets a more even distribution of precipitation across the year throughout the islands, although along this mountainous set of islands, the main population centres along the east and southern coasts experience summer rainfall peaks, while the north and west facing coasts get noticeable winter peaks, usually in the form of snow. In fact Sapporo, the largest city on the northern island of Hokkaido, is the snowiest city in the world, thanks to the winter monsoon winds.
Because of the Sea of Japan, the seasonal reversal of monsoon winds bring rain in Summer and Snow in Winter
Sapporo receives deluges of snow in winter, while Tokyo, on the southern side of mountains, sees a summer rainfall peak
Typhoons in East Asia are another distinction between this part of the monsoon and that of the Indian part. These often ferocious storms account for a considerable proportion of total rainfall in the season as they lash cities from Taiwan and Hong Kong in the South to Japan in the north.
Siberia & Conclusion
The East Asian Monsoon’s influence reaches its end in the far north of Eastern Siberia, where the influence of the winter Siberian High leads to very dry winters. In summer, southerly monsoon winds still penetrate this vast area, bringing rain, but by this stage, are weakened considerably and the amounts are little compared to those further south. Still it is a remarkable fact that a singly connected weather system can affect such a large area, across so many lines of latitude, from 20°N in India, through to 70°N in Siberia. Such is the power of the monsoon.
The deep Siberian High Pressure zone is responsible for the entire Asian monsoon winter pattern
Even Irkutsk, in the subarctic of Siberia, feels the influence of summer monsoon rains
The Asian Monsoon varies in intensity from one year to another, affecting both India and China, so these average rainfall graphs, as always, can be deceptive in hiding the true pattern of annual variability. Too little rain, and effective drought can occur, since the rest of the year in many places is very dry already. Too much rain, and flooding occurs across large areas, in addition to landslides along the southern and eastern edges of the Himalayas. Too little and too much rain can lead to many thousands of deaths in this way. The monsoon is a taker as well as a bringer of life.
For hundreds of millions of years they have they have defined the rhythm of nature on our planet. They underpin the daily existence of billions of us today. A product of the clockwork of the heavens. These are the seasons of Planet Earth.
Astronomical Origins
When talking about climate, one cannot ignore the concept of the seasons. It’s the variation in temperature and precipitation throughout the year that defines each climate zone on our planet. Each zone has a unique combination of seasonal patterns. And these patterns determine the biome – the characteristic of vegetation – of the land in that zone, what agriculture can be sustained there, and ultimately whether it can support human population.
But what are the seasons? What is their origin? Why do they always repeat year after year? Why are they different in the tropics than in the higher latitudes? Why do they reverse in the southern hemisphere?
All these questions are answered in the relationship between our planet and its parent star – the sun.
When a planet orbits a star, it traces an elliptical path that is always in the same horizontal plane – the orbital plane. But the planet itself will rotate on its own axis at some other angle – what is known as axial tilt. The result of this is that as the planet moves around the star, the angle at which the star’s light strikes any particular point on that planet will change. As surface and atmospheric heating is directly related to the angle of the star’s light, the position of the orbit will therefore influence temperature for that region of the planet. So every planet in the galaxy with an atmosphere will have some combination of seasons, and so the phenomenon shouldn’t be thought of as unique to our planet. In fact the planets Mars, Saturn, Uranus, and Neptune and Saturn’s moon Titan all have distinct seasons that have been observed.
Axial Tilt is the angle around which a planet rotates about its axis compared with its orbital plane around its parent star
In summer rays from the parent star hit the ground at a steep angle, producing a large heating effect
In winter rays from the parent star hit the ground at the same spot at a shallower angle, producing a smaller heating effect
Every planet in the universe with an atmosphere that orbits a star will have seasons
There are four significant points in any planet’s orbit in this regard – the first two being when each of the planet’s poles is pointing closest toward the star, and the second two being when the poles are exactly at right angles to the star.
In the case of our planet, our axial tilt is just over 23°. So on the day when the North Pole is facing closest toward the sun, June 21st to be precise, every point on a line encircling the earth 23° north of the equator will experience a midday sun that is exactly overhead. This is midsummer in the northern hemisphere, when heating from sunlight is at its greatest.
Exactly 6 months later, on December 21st, when the South Pole is facing closest toward the sun, every point on Earth 23° south of the equator will have a noonday sun overhead. This is midsummer in the southern hemisphere.
These two lines are respectively the Tropics of Cancer and Capricorn, called such because the sun is in those zodiac constellations on those special days, which are known as the summer and winter solstices. The word solstice comes from Latin [sol + stit], meaning “sun stationary”, and literally describes the stop and reversal of the sun’s highest or lowest daily point in its seasonal progression.
Exactly in between the solstices, on March 21 and September 21, the Earth’s poles are at an exact right angle to the sun, which means that on these days, the sun at noon at the equator is directly overhead. These days are called equinoxes – from the Latin [aequus + nox], meaning “equal night”. The hours of day and night across every point on earth are the same at 12 hours each on these special days.
Earth has an Axial Tilt of just over 23°
The Tropic of Cancer is that line around the earth at just over 23°N that sees the sun at the zenith at noon on June 21st
The Tropic of Capricorn is that line around the earth at just over 23°S that sees the sun at the zenith at noon on December 21st
At the equator, the sun is at the zenith at noon on March 21st and September 21st
In practice, midsummer temperature peaks lag behind midsummers day by a month or so – most will experience that July and August are the hottest months in the Northern Hemisphere, and not June. And the same goes for winter, with January and February being the coldest, and not December. This is called “seasonal lag” and occurs because it takes time for the earth and oceans particularly to warm up in that area.
This cycle repeats itself near-exactly, year in year out, because the Earth returns back to the same point exactly one year later, as regular as clockwork (if human-made clocks could ever be so precise). I say near exactly, because the Earth is in fact wobbling by a few degrees on its axis, in the same way a spinning top might wobble. But this wobble has a cycle of almost 26 thousand years, so… you’re not going to notice anything in your lifetime.
Peak temperatures lag a month or so behind the summer solstice due to slow oceanic heating
While the current axial tilt of the Earth is 23.4° it will cycle over a very long period between 22° and 24.5°
Atmosphere
Ok, so that explains the origin of the seasons, but the effects of this on daily weather depend upon whether you live inside or outside of the Tropics of Cancer and Capricorn. Within the Tropics, the changes in the angle of sunlight from one solstice to the other has little or no influence on surface heating and so the tropics see very little change in temperatures across the year.
Seasons in the tropics are in fact determined by the presence or absence of rain. When the sun is at right angles to the earth, heating is at its greatest, leading to thermals of hot moist air, which, when rising into the upper atmosphere, cool, losing their moisture, and depositing rain in the form of thunderstorms. As the sun tracks back and forth across the equator throughout the year, this band of rain follows it. This band is called the doldrums, or Inter-Tropical Convergence Zone (ITCZ), as it is the convergence of tropical winds, known as trade winds, being sucked into it from surrounding areas. When these winds carry moisture, they also bring rain, and so this complex pattern determines what areas will be wet or dry during what season. Only where the ITCZ is stable, or where trade winds carry moisture regardless of direction do we have the Tropical Rainforest, where rainfall and temperature are near constant – the only climate on earth without seasons.
In July, the ITCZ, with its accompanying thunderstorms, is north of the equator and brings the wet season to the northern tropics
In January, the ITCZ, with its accompanying thunderstorms, is south of the equator and brings the wet season to the southern tropics
Outside the tropics though, these sunlight angles become important. If you know anything about trigonometry, then you’ll get the idea that as the angle of sunlight to the surface becomes shallower, there is an acceleration of the effect of that heat spreading out across the surface and being diluted in power. So that by the time you reach the poles, the heating effect of the sunlight is only a tiny fraction of what it is at the equator.
A shallower sun angle means the heat from the sun is spread over a wider area, diluting its power, and reducing heating effect
The angle of the sun varies little in the tropics, and so temperatures changes between summer and winter are small
At the mid latitudes, the change in sun angle between winter and summer is much greater, leading to bigger temperature changes
In the mid latitudes, the change in seasonal angles is significant enough to produce large changes in temperature. In summer the sun is high above the horizon, concentrating heat and delivering warm or hot days. In winter, it’s much closer to the horizon and so surface heating is much less, with the result of significantly colder days.
This variation in temperature in the mid-latitudes is diluted, however, by the proximity of oceans. Being a large fluid mass, kilometres deep, the oceans do not heat as much in summer as the land, and do not cool as much in winter. So land areas near an ocean have much smaller winter/summer temperature ranges than those in a continental interior. This difference in coastal and interior continental temperatures is at its greatest in the mid-latitudes and is the essence of why we have more climate types in this region of earth than any other.
Proximity to oceans has a moderating influence on seasonal temperature changes
The tropics see little seasonal change between day and night duration, while polar regions see huge changes
In the polar regions, the effect of axial tilt is at its extreme. Above the polar circle at 67°N, there is at least one day each winter when the sun does not even climb above the horizon, and at least one day each summer when the sun never sets. As one approaches the pole, these number of days increase until at the North Pole, the sun doesn’t rise for 6 months in winter, and stays above the horizon for 6 months in summer. The same occurs at the opposite time of year in Antarctica.
Global Seasons and Climate in One Chart
Seasonal Changes in Temperature and Precipitation by Climate Type
In the Koppen climate classification system, we have categorised patterns of temperature and rainfall determined by the seasons. You can learn more about this in my intro article or by watching my Secrets of World Climate series which covers each zone in detail. What you almost certainly haven’t seen before, is a representation of seasons across all Koppen zones in one image. And here it is.
For readability, I have grouped similar zones together or omitted rare or isolated ones. This list shows the most important and distinct zones, starting at the equator at the top and finishing at the pole at the bottom of the page. For each zone I have depicted the change in temperature across the year in a colour spectrum, from red as the hottest to purple as the coldest. Below each temperature progression is a progression of precipitation, with rain in blue, snow in white, and intensity of such precipitation as proportional shading. These patterns are for the northern hemisphere and will naturally be reversed for the southern.
Up top we see the unchanging single hot and wet season of the Tropical Rainforest. Next we see the change in rainfall across the year in the Tropical Monsoon and Savannah climates, and a slight bump in temperature just before the wet season.
After this we see the unique Subtropical Highland climate, where temperatures are reduced due to altitude. Note that there is a form of this climate where the rain is constant year round, but is not shown here.
Then we come to the Hot Desert, where there is little to no rain, but intensely hot conditions in summer.
We then have the unique three season climate of the Subtropical Monsoon – a mild dry winter, then a short and very hot dry summer, followed by hot wet season.
As we move into the mid latitudes, we get our first cool winter temperatures in the Humid Subtropical, followed by the unique dry summer /wet winter pattern of the Mediterranean climate zones. This latter, together with its westerly ocean facing sibling, the Oceanic, demonstrate mild temperature ranges from winter to summer.
By contrast the Continental climate zones that follow show much more extreme temperature ranges, with subdivisions of these being the cool deserts, with absence of rain, Humid Continental, where we see snow and rain defining seasonal precipitation and Continental Monsoon, where this pattern is varied by an absence of winter precipitation. The final continental climate of the Subarctic is then seen with extreme temperature ranges featuring very cold winters yet warm summers.
As we reach the poles, freezing temperatures dominate with only a brief cool summer in the tundra bringing any respite to these forbidding lands.