Lima, Peru’s capital city with over 10 million residents, lies uniquely between towering Andes mountains and the vast Pacific Ocean. Known for its rare tropical desert climate, Lima surprises with mild temperatures, persistent fog, and almost no rain. Discover why Lima’s climate is unlike any other city in the world.
Lima’s Origins and Tropical Location
Founded in 1535 during the Spanish conquest, Lima is Peru’s capital and sits at just 12°S latitude, placing it deep within the tropics. It spans the Pacific coast, enclosing a population exceeding 10 million in its metropolitan area. Despite its tropical position, the city receives virtually no rain, a stark contrast to other tropical metropolises. Lima instead experiences persistent high humidity, frequent low clouds and fog, and extremely dry weather overall.
Why Tropical Deserts Are Rare—and Why Lima Is One
Most deserts around the world belong to one of two categories: hot subtropical deserts, found just outside the tropics (beyond 23° latitude), and cold deserts, found inland or in mountain rain shadows. Tropical deserts—especially major urban ones—are nearly unheard of. Lima defies these norms thanks to two key factors: the Andes mountains and the Humboldt Current.
The Andes: Blocking the Rainy Season
To the city’s east, the Andes soar above 6,300 m (20,000 ft), acting as a natural barrier to moist trade winds arriving from the equatorial Pacific during the summer. Without them, Lima would experience a classic tropical savannah pattern: a defined wet season followed by a dry one. Instead, the Andes block that moisture entirely, leaving the city dry year-round.
The Humboldt Current: Cooling the Tropics
Parallel to the coast flows the cold Humboldt (or Peru) Current, which brings frigid waters from the mid-latitudes toward the equator. Near Ecuadorian borders, water temperatures hover around 16 °C, roughly 10 °C cooler than expected for a tropical latitude. This dramatically cools the air above the ocean, which shapes Lima’s unusual climate.
Mild Temperatures and Persistent Fog
Thanks to the cool current, Lima’s coastal climate stays mild. Winters see lows around 14 °C, not the typical low twenties of the tropics, while summers average 26 °C, rather than surpassing 30 °C. With relative humidity often above 80%, moist air and fog blanket the city—especially in winter. Lima is, in fact, one of the cloudiest cities globally, logging just 1,230 sunshine hours annually—which is half what cities like Bangkok enjoy.
Why Lima’s Humidity Doesn’t Rain
To understand why humidity doesn’t translate into rain here, recall that warm air holds more moisture than cool air. Rain requires air to rise, cool, and condense—either via storm systems or by being lifted over mountains. However, Lima’s daytime land temperatures, heated by tropical suns, remain warmer than the cool ocean. Any fog or moisture that drifts inland quickly evaporates. Without uplift, Lima’s clouds remain shallow, turning to fog rather than rainfall.
Result: A Never-Raining Tropical Desert
The combination of the rain-blocking Andes and cold Pacific waters creates exceptionally stable atmospheric conditions. The water droplets in Lima’s sky simply don’t collide and grow large enough to become rain. As a result, Lima sits firmly in the BWh (Hot Desert) category of Köppen’s classification: “B” for dry, “W” for desert, and “h” indicating a mean annual temperature above 18 °C. Though some sources have playfully suggested an unofficial “BWn” label for “mild desert,” this is not recognized in peer-reviewed climate studies.
Desert Cities and Water Solutions
Lima isn’t the only city built in a desert, but being in the tropics makes it unique. Despite its arid conditions, the city has managed to grow steadily, thanks to water sourced from Andean springs and rivers, pumped down into the basin. Meanwhile, more remote coastal communities have turned to innovative methods: they install fog nets, which condense moisture from coastal fog into drinkable water—an ingenious workaround to the city’s lack of rainfall.
Conclusion: A Climate Shaped by Nature and Geography
Lima defies expectations—a sprawling tropical metropolis in a near-rainless desert climate. The towering Andes shut out rain-bearing winds, while the cold Humboldt Current chills the coast. The result is a city cloaked in fog, bathed in mild air, and rich in water ingenuity despite its desert classification. Lima’s climate is a masterclass in geography, meteorology, and human adaptation.
What Is a Continental Climate? Everything You Need to Know”
Continental climates are known for their extreme temperature shifts. Summers can be scorching, while winters turn bitterly cold. These regions lie far from the ocean, so they don’t benefit from its moderating influence. Nevertheless, they support hundreds of millions of people and include some of the world’s most productive agricultural zones.
The Geographical Band of Continental Climates
Continental climates stretch across a wide zone in the Northern Hemisphere’s mid-latitudes. This zone runs through Canada’s prairies, the American Midwest, and the vast steppes of Eastern Europe. It continues deep into the Russian interior and reaches Northern China. Interestingly, you won’t find this climate type in the Southern Hemisphere. This absence is due to the lack of large landmasses far enough from the sea.
Temperature Extremes and Clear Seasons
Because oceans can’t influence these areas, temperatures swing wildly throughout the year. Summers are hot and sunny. In contrast, winters bring long freezes and snow. These dramatic changes create one of the clearest four-season cycles on Earth. According to the Köppen classification system, these climates fall under the Dfa and Dfb categories, depending on how warm the summer gets.
Different Types and Rainfall Patterns
There are six main types of continental climates. They vary based on how hot the summer is and when rain falls. While most regions follow a steady pattern, there are some exceptions. For example, a few areas in Central and East Asia experience unusual rainfall rhythms. In some cases, they even resemble Mediterranean or monsoon climates. As a result, the continental climate zone is far more diverse than it might first appear.
Vegetation and Ecosystems
What grows here depends on how much it rains. In drier parts, you’ll see endless grasslands. However, where rainfall increases, forests appear—first mixed woodlands, then thick pine forests farther north. This mix supports vast farms that grow crops like wheat and corn, as well as wild forests that shape the landscape.
Regional Differences Around the World
Continental climates appear in many forms across the globe. In Canada and the U.S. Midwest, for instance, they drive large-scale grain farming and support major cities near the Great Lakes. In Eastern Europe and Western Russia, they fuel agriculture and have shaped cultural life around long winters. Meanwhile, in Northern China, Korea, and Japan, monsoon rains combine with cold winters, creating complex seasonal cycles. Additionally, on the Tibetan Plateau and in eastern Siberia, high altitudes and isolation create rare and extreme versions of this climate.
The Role of Wind and Mountains
Mountains play a key role in shaping this climate. For example, the Rockies block moist air from the Pacific, forcing North America’s rain to come mostly from the south. On the other hand, in Eurasia, winds from the Atlantic bring steady moisture across wide plains. Since there are no major mountain ranges in the way, this moisture travels far inland.
So, continental climates are some of the most dramatic on Earth. Thanks to their sharp seasonal contrasts and diverse ecosystems, they present real challenges. Even so, people not only live in these regions—they thrive. These climates support huge populations and help feed the world. Therefore, they offer a powerful example of how life adapts to even the most extreme conditions.
New York is Subtropical. Really? According to the Koppen Climate Classification, it has the same Humid Subtropical Climate as New Orleans in the Deep South. Sounds crazy, doesn’t it? And what...
Microclimates – dramatic shifts in temperature, rainfall or both over just a few kilometers or miles. How are these sudden shifts possible. In this video I look at the five basic types of...
Seasons – Origin and Variation Across Earth. Types Of Seasons by Climate Zone There are various types of seasons on this earth, determined by which climate zone one is in. In this video, I will...
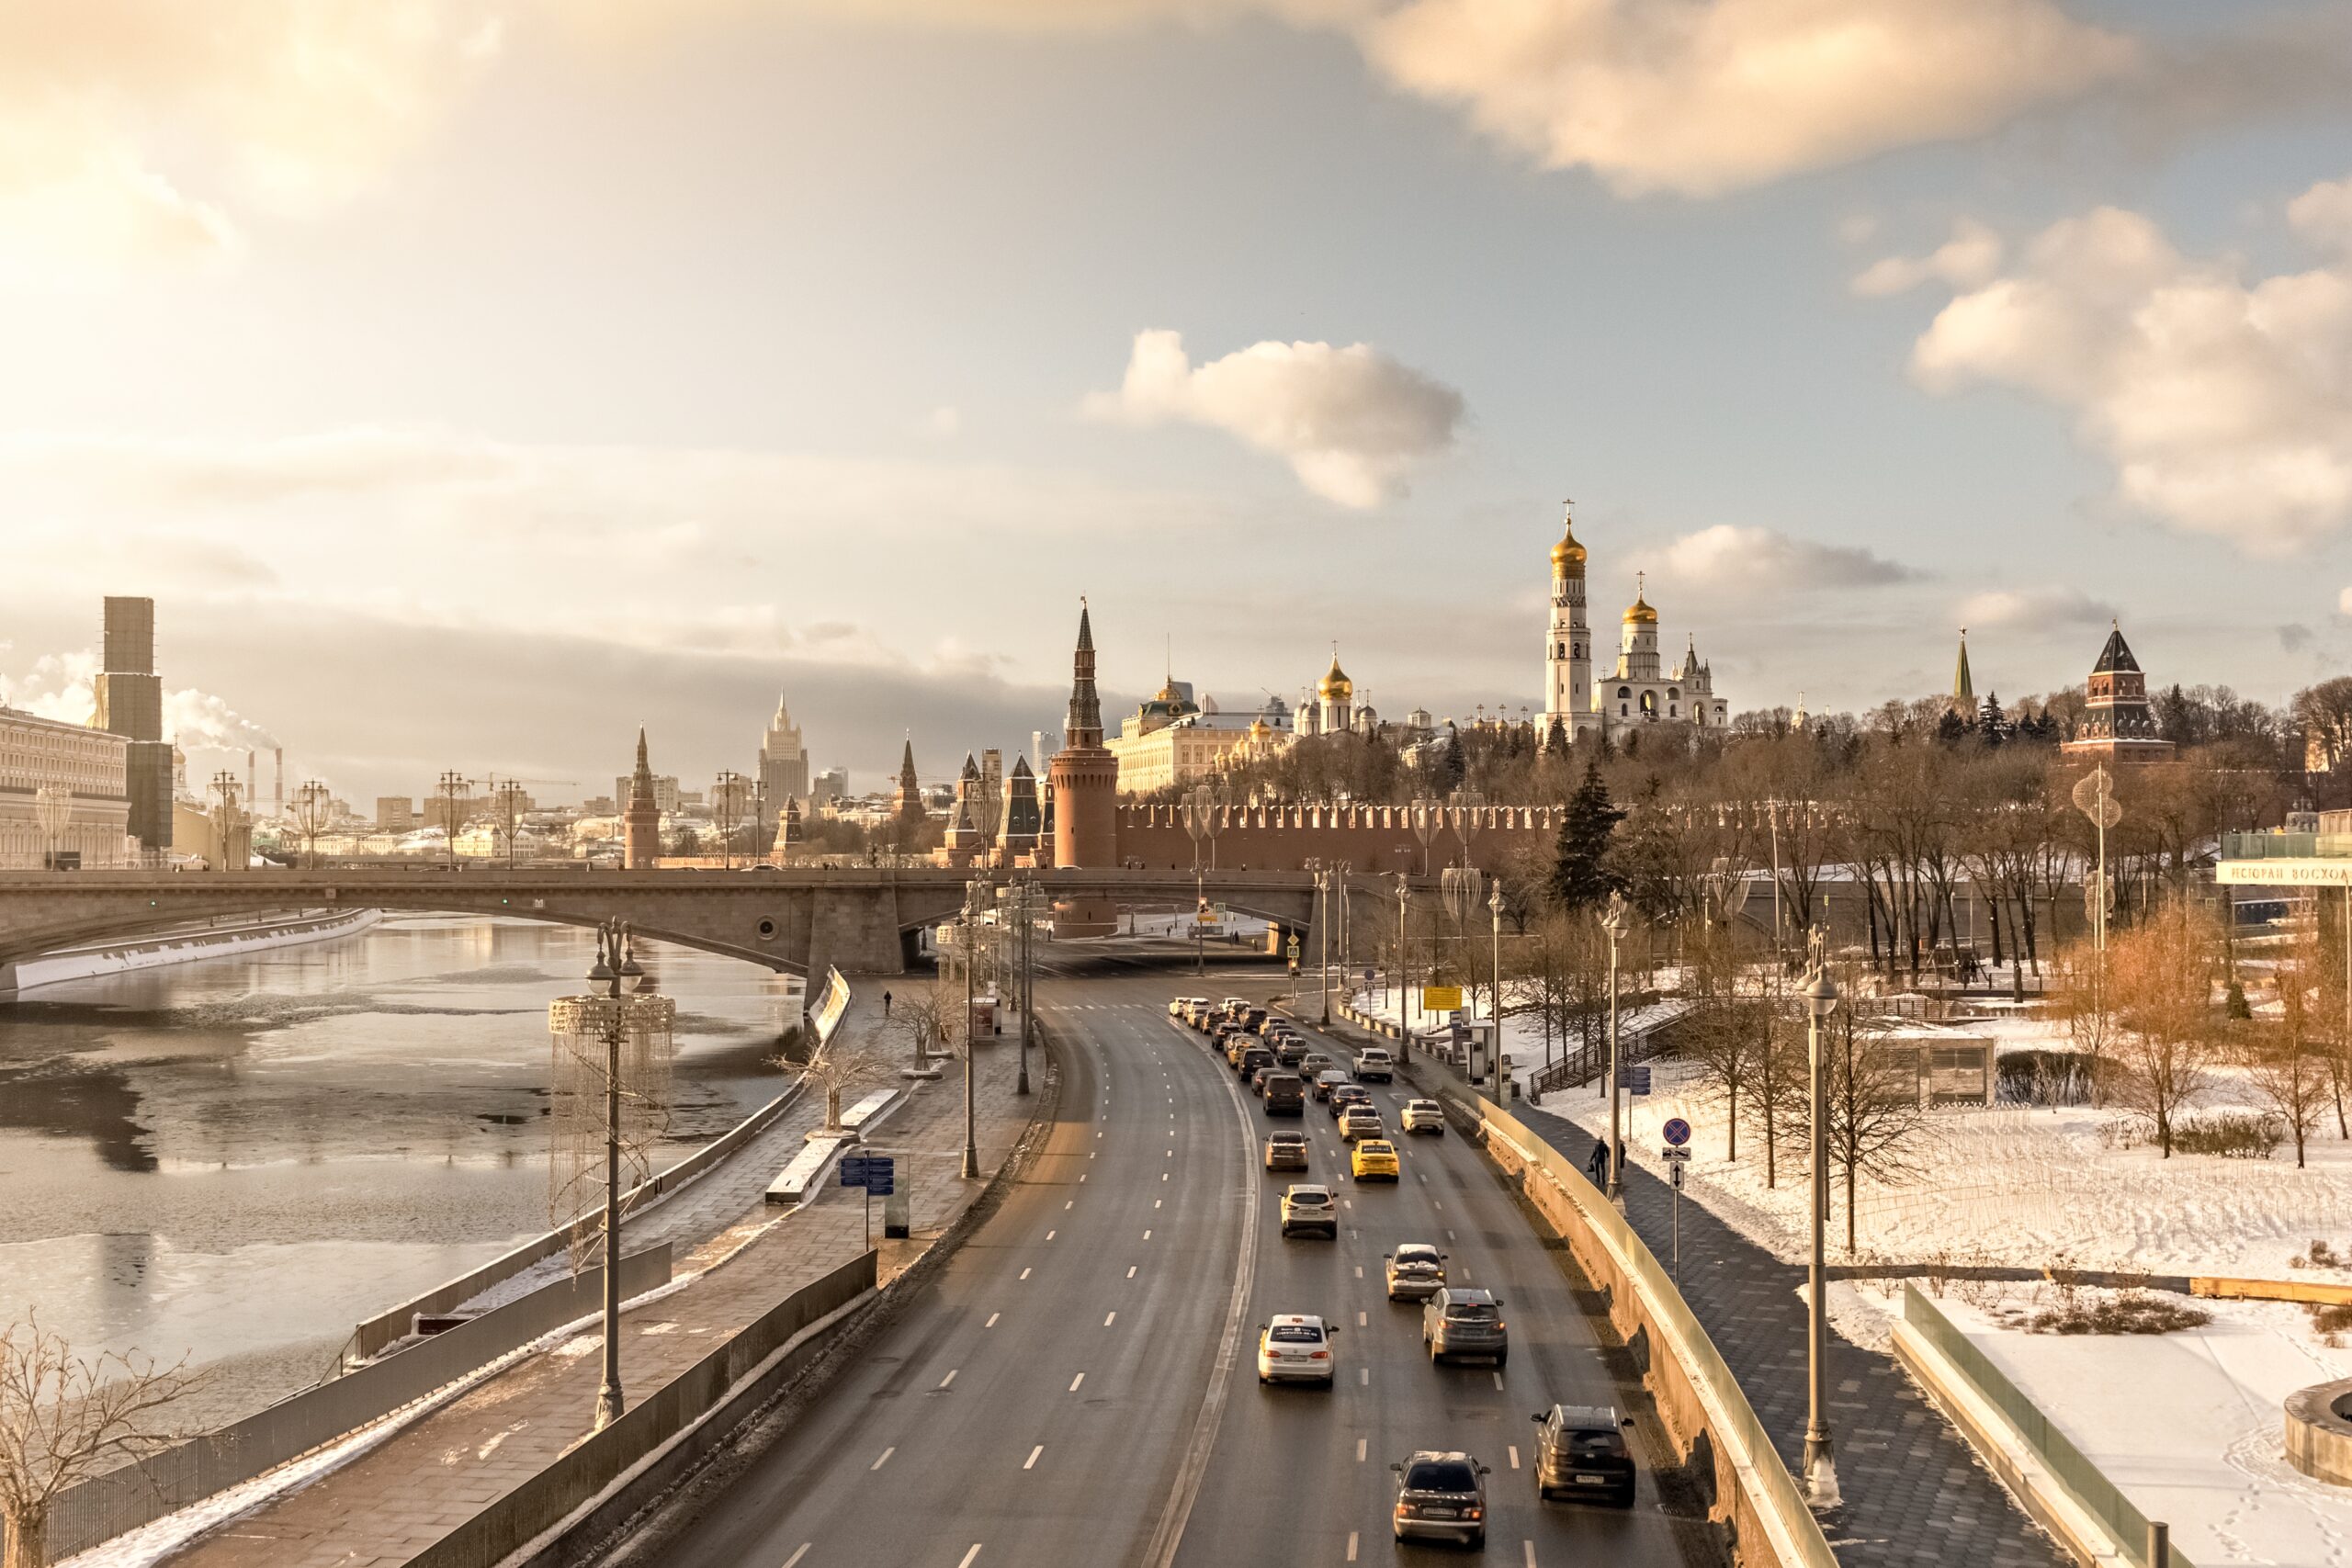
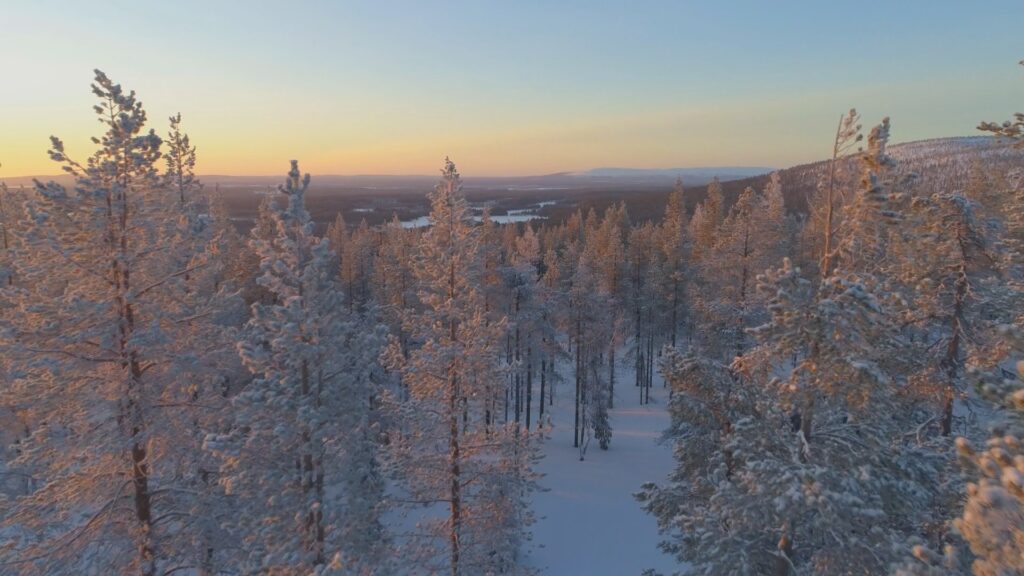
Warm summers … but long, dark, cold winters. Here in the far north of the major continents, we find the widest temperature ranges to be found anywhere on earth.
One of the last great wildernesses, the few cities that are here are the coldest on the planet. A place of snow, swamp, lake and trees. These are the lands of the boreal forest. The taiga. Welcome to the subarctic.
Description and Dynamics
In our journey from equator to pole, we have spent the last two chapters looking at the three climates found within the great continents, the cool deserts and the mixed woods and grasslands of the humid continental. It’s now time to take a look at the last of these, the coldest and most northerly of them, the climate of the endless coniferous forests of North America and Eurasia.
The climate itself is referred to as subarctic by most climatologists, but because of the almost exclusive biome of coniferous forest that mark these zones, it often goes by the name of such forests, which are called boreal forest or taiga, the latter word coming from Russian, and which should not be confused with… tiger. Incidentally, tigers live in the taiga – the Siberian Tiger is the largest cat on the planet… But I digress… 🙂
This climate zone houses the world’s largest extent of forests – with almost a third of all trees planetwide found here. They cover in a virtually unbroken sea of dark green, the entire width of the northern continents, from Alaska to Labrador in North America, and from Norway to Siberia and Kamchatka in Eurasia. But opposite to their equatorial cousins – the Tropical Rainforests – these regions have the lowest biodiversity of anywhere on earth, being dominated by often single species trees, such as larch, fir, pine and spruce.
This climate type also occurs in comparatively tiny pockets in more southerly alpine areas, as a result of altitude cooling, specifically in the Rocky Mountains in North America, the Pyrenees, Alps and Carpathians of Europe and the Tibetan plateau in Asia.
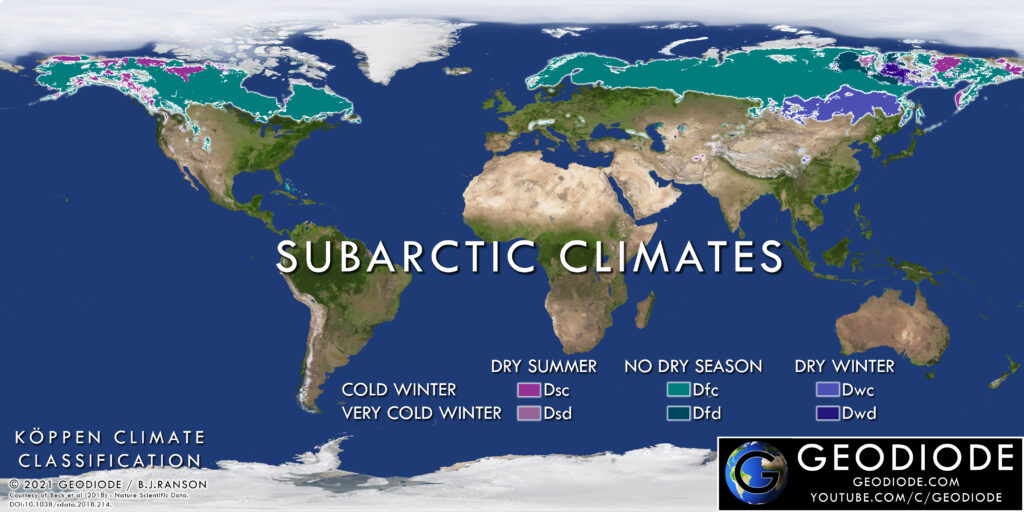
Global distribution of Subarctic climate zones with the six Koppen codes
In the Koppen Climate Classification, there are, like the humid continental climates to their immediate south, six divisions of the subarctic climate, separated by patterns of rain and snow and winter temperature. Dominating these six is the one called Dfc, which has year round precipitation – rain in summer, snow in winter, and where at least one full month of the year has an average day/night temperature of 10°C (50°F). This variant accounts for almost 90% of subarctic climate coverage, spanning the entire width of the northern continents.
In the northern Far East, Dfc is supplanted by Dwc, having similar temperatures, but with a monsoon influence pattern of precipitation, with dry winters and wet summers. Yes, the Asian Monsoon makes it this far north, such is the extent of the world’s largest weather system.
10°C might seem like a chilly summer day, but this is a day/night average, and the peak daytime temperature can often exceed 20°C, equivalent to that of the Oceanic climates such as Britain.
Winters are a different story, however. Far from the ocean, and so far north that winter days can be very short, and the nights long, temperatures plummet to -20°C (-4°F) or below as a 24-hour average.
And things only get worse in north-eastern Siberia. Here, we need a colder set of Koppen designations – Dfd and Dwd, because it is here that the winter temperatures fall to the lowest recorded anywhere outside Antarctica. In this classification, winter day/night averages must be below -38°C (-36.4°F), and night lows in winter often fall below -50°C (-58°F). Yet, due to continentality, and long hours of subarctic sunlight, summers here are still surprisingly warm, with peak day temperatures above 23°C (73°F).
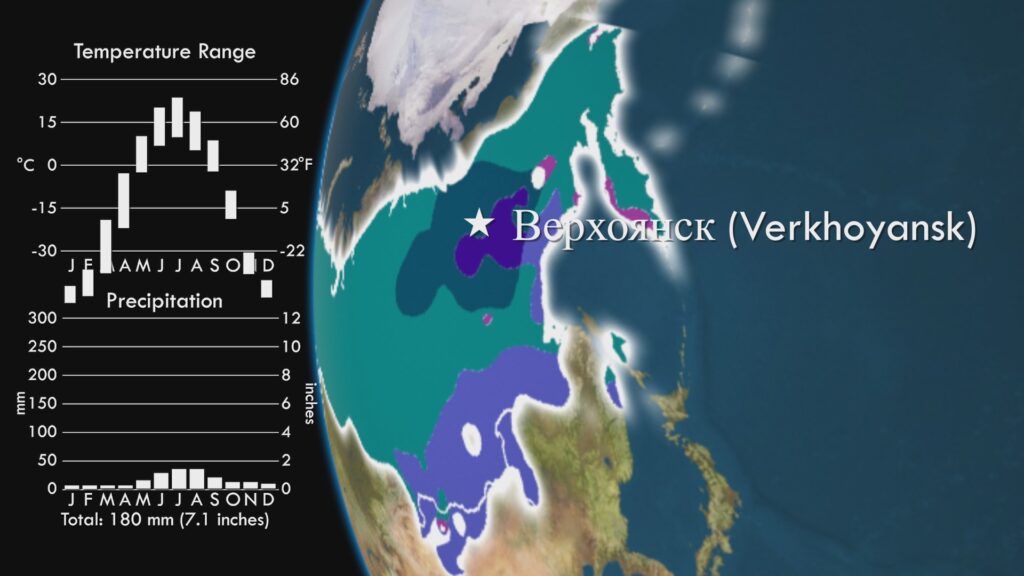
Verkhoyansk in NE Siberia has the highest annual temperature range in the world
There is a town in north eastern Siberia that you’ve probably never heard of. But to anyone familiar with climate study, it is well known. Its name is Verkhoyansk, and it is home to the widest recorded temperature range on the planet. Here you can see its rather impressive graph, with a temperature range of summer day to winter night being a staggering 72°C. But this only shows averages. The highest ever recorded temperature here was 38°C (100.4°F) in June 2020, while the lowest was -67.6°C (-89.7°F) – that’s a range of almost 106°C!
The amount of rain falling within these climate zones is usually low in comparison to others, due to continentality. But because of the low average annual temperatures, evaporation of water is low, allowing the growth of hardened coniferous trees which have specialised in their evolution to thrive in these extreme climates. If thrive could be said, because the growing season in these cold climes is limited to just a few short months in summer, and so the trees can take decades to grow to any reasonable size, and usually live for centuries.
Where in the world do we find the Subarctic climates?
So, where in the world are the subarctic climate zones? In short they dominate the northern hemisphere between 50-70 degrees in latitude.
In North America, all but the north coast of Alaska is covered by this climate, along with most of the northern half of the great Canadian plains, from the Yukon in the west to Labrador in the east.
In Europe, this climate dominates Scandinavia, with most of Iceland, all but the oceanic west coast in Norway, the northern two thirds of Sweden and all but the southern fringe of Finland coming under its sway. Iceland is the only notable exception to the rule of the subarctic being covered with pine forest. Once, this island was forested in the same way, but the dependency on the human settlements here on local materials resulted in almost total deforestation of the land centuries ago, leaving a bleak landscape in its place.
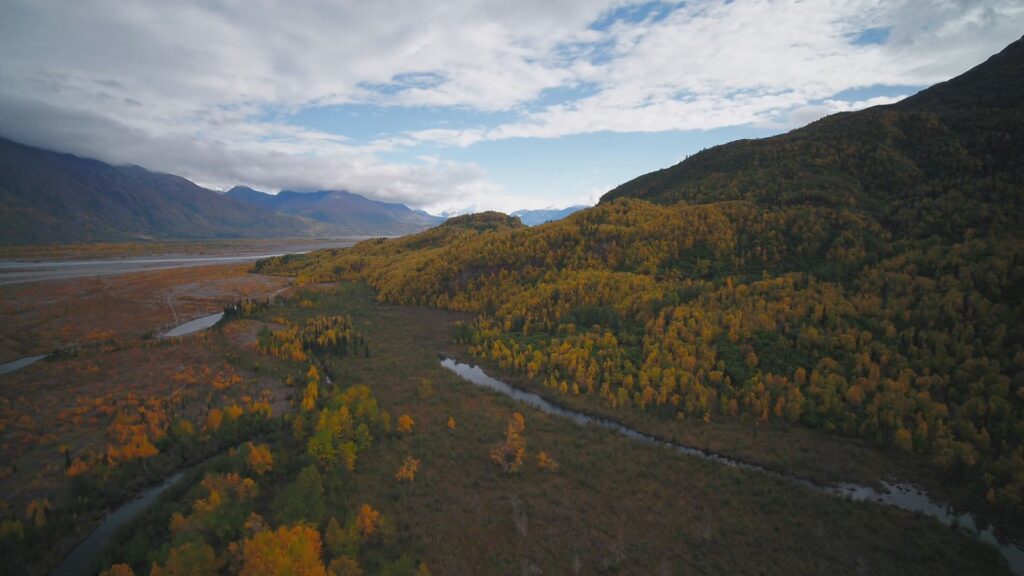
Subarctic landscape in Alaska, USA, with the ubiquitous Boreal Forest (Taiga)
Taiga in Finland. Most of this country is within the Subarctic climate type
As we continue east into Russia, the majority of this enormous country is blanketed by the taiga, with the band widening from the northern half of European Russia in the west to encompass all but the frigid northern coasts in the centre and east, in one of the most famous and forbidding regions in the world – Siberia. The subarctic climate extends all the way to the Kamchatka peninsula in the Far East before finishing at the Bering Straits, a stone’s throw from Alaska, where we began.
Landscapes and Vegetation
As mentioned, and obvious from all you have seen in this chapter so far, this climate is virtually synonymous with the boreal forest, or taiga. Patterns in this seemingly homogenous forest do exist, however. Different species of trees tend to dominate different regions – spruces in North America, for example, while eastern Siberia and its extreme winter temperatures is dominated by the hardiest conifers of all… the Siberian Larch.
In the south the taiga gradually gives way to mixed woodland and deciduous forest, such as in Eastern Canada, or to grasslands where there is more aridity, such as in Central Russia or east of the Rockies. In the north, even the trees eventually give way to the barren grasses of the Tundra, which we’ll take up in the next chapter.
Due to the low evaporation rates in this land of weak sun, the rain and snow that does fall in the flat basins that dominate the upper latitudes tends to persist, forming large swamps, bogs or lakes. If you’ve ever looked at a map of Finland or Northern Canada, then you’ll have noticed this. Such areas of standing water are havens for mosquito breeding, and much of Siberia is particularly plagued by such creatures in summer, just in case you were thinking this respite from the frozen conditions might make for a pleasant camping trip.
Because of the long winters, the ground is permanently frozen below a certain depth. This is known as permafrost. The depth at which it is frozen depends on latitude – with more southerly regions having soil with a thinner layer of ice at a deeper level compared to more northerly areas where the ice is thicker and closer to the surface. On average, the ground stays frozen just a few feet below the surface. We’ll talk more about the permafrost in the next chapter.
Farming in such conditions is extremely difficult and there is almost no farming on any scale worth mentioning in these bleak regions.
Notable places with Subarctic Climates
Human Settlement
These factors in combination make the subarctic a forbidding place in regard to human settlement, and so these areas are consequently very sparsely populated, the exceptions being where the location has specific strategic advantage or where rich natural resources are found.
There are only four cities of any size worthy of mention here. Anchorage Alaska has grown over the last hundred years as a rail and aviation hub, and with its coastal location, the climate is relatively moderate under the maritime influence. Murmansk, a significant strategic naval base on the arctic coast of Russia by Scandinavia, and the largest city above the arctic circle, is similarly moderated by an ice-free sea.
This is not true for the other two major cities in the subarctic. Norilsk, a metallurgical mining centre in Northern Siberia is the most northerly city above 100,000 population and is regarded as the coldest city in the world by its average temperature year round of nearly minus 10 degrees celsius. Lastly, Yakutsk, a diamond mining centre in Eastern Siberia has the coldest winters of any major city in the world with a day/night average in January of almost -39°C (-38°F). Fun times.
Coursework Questions
What are the main differences between the subarctic climate and the continental climates to the south?
Explain the logic behind the six Continental Koppen climate codes, detailing the three rainfall distribution letters and two temperature range letters. Which is the most important of the six?
Why do places like Verkhoyansk in NE Siberia have such extreme annual temperature ranges?
What is the dominant form of vegetation in the subarctic?
List out some countries and areas that experience subarctic climates.
The treeless Arctic. A desolate region, where few things grow. Yet, rich in fauna, both on the land, and at sea, and is the home of an iconic animal in this world of climatic uncertainty.
A famous people survive here toughing it out in the most hostile populated climate on earth. A barren land of ice, lake, swamp and grass. This is the northern tip of our planet… this is the tundra.
Description and Dynamics In the last chapter we looked at the subarctic lands dominated by the boreal forest, the taiga. Now, as we travel even further north in our journey from equator to pole, we arrive in the true Arctic itself, and this region is dominated by the treeless expanse known as the tundra.
Our word for this biome, like the Taiga of the Sub-Arctic, is also borrowed from Russian, with roots in the Sami word for “treeless uplands”. But whereas the Taiga is dominated by enormous forest, the tundra, by contrast, and by definition, is devoid of trees, and is a bleak land consisting only of dwarf shrubs, hardy grasses, mosses and lichen.
The reason that trees cannot grow here is simple – it’s too cold. And by this, specifically, we mean that summer temperatures must be above 10 degrees C for at least a month in summer in order for trees to complete their necessary seasonal cycles. But for anything to grow at all, temperatures must be above freezing. And these two temperature points give us the climatic definition of the tundra – summer temperatures must be between 0 and 10 degrees.
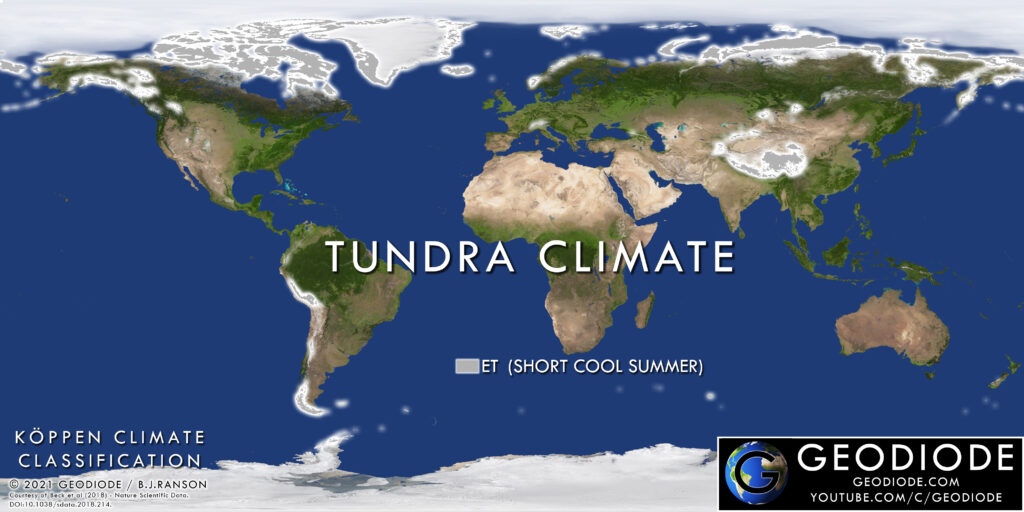
Global distribution of the Tundra climate zone
Interestingly, winter temperatures are not as extreme as some of those found in the sub-arctic regions of north-eastern Siberia. This is because the tundra areas are never that far from the coasts of the arctic ocean, and so are moderated somewhat, even though this ocean is ice covered for half the year or more.
Average temperatures in the tundra, like in the sub-arctic, are cold enough to produce a layer of permanently frozen soil throughout the year, known as permafrost. This is another factor limiting the growth of more substantial plants which would otherwise demand deeper root structures.
The tundra is very low in precipitation, comparable to desert and semi-arid regions closer to the equator. But because of the low evaporation rates from such low temperatures, and the barrier of the permafrost preventing proper drainage, water stays around, allowing many dwarf species of plants to grow.
Where in the world do we find the Tundra climate? So, where in the world can we find the tundra? The classic tundra, with cool summers and very cold winters that produces the permafrost, is found only in the arctic, and includes the northern coast of Alaska, almost all the northern coast and islands of Canada, the coasts of Greenland, Svalbard – a large island north of Norway, and most of the northern coasts of Russia.
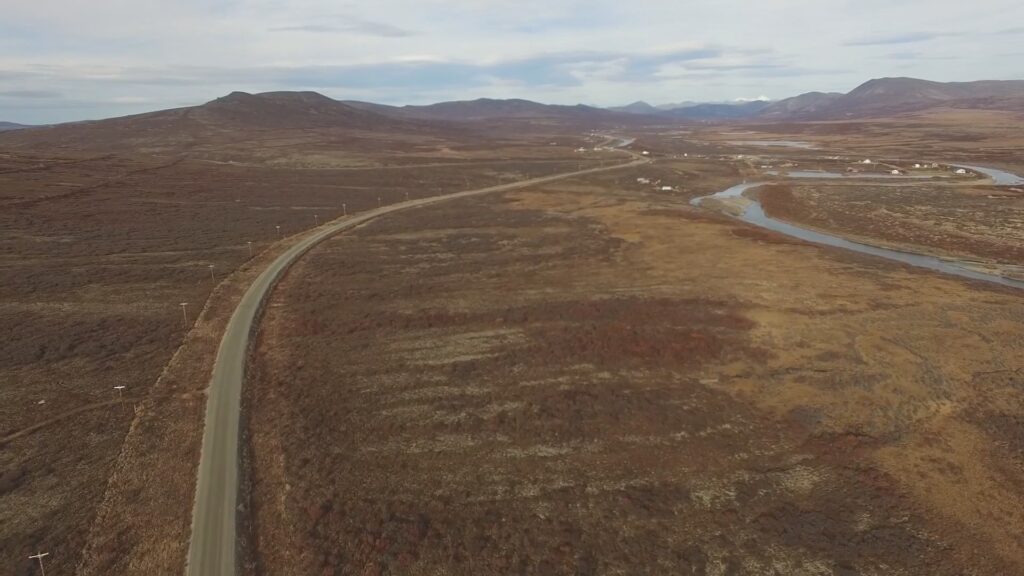
Tundra in summer, near Nome, Alaska. Image courtesy of IBWOVids
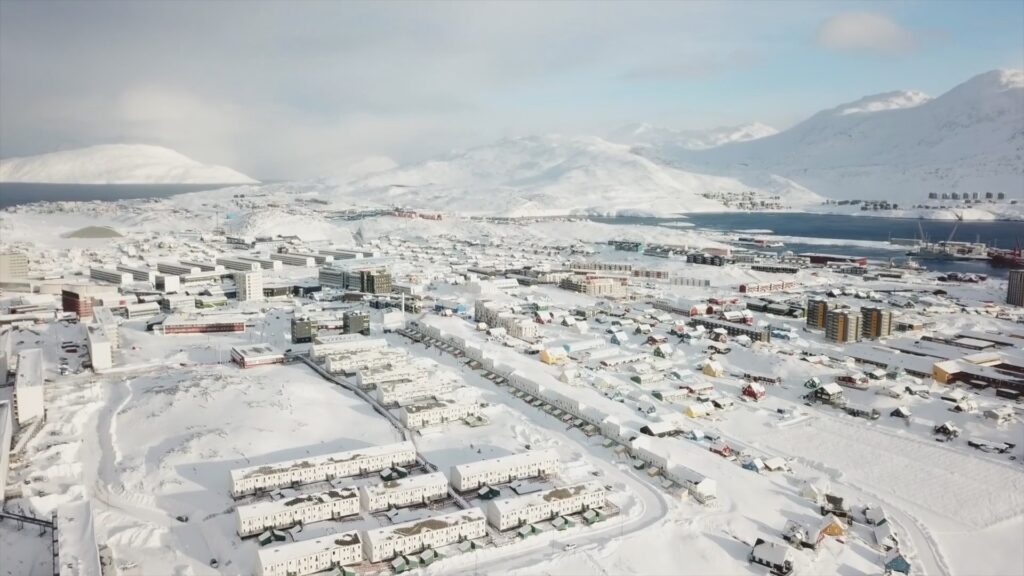
Nuuk, the capital of Greenland, the largest city in the Tundra. Image courtest of Reimund Langgaard
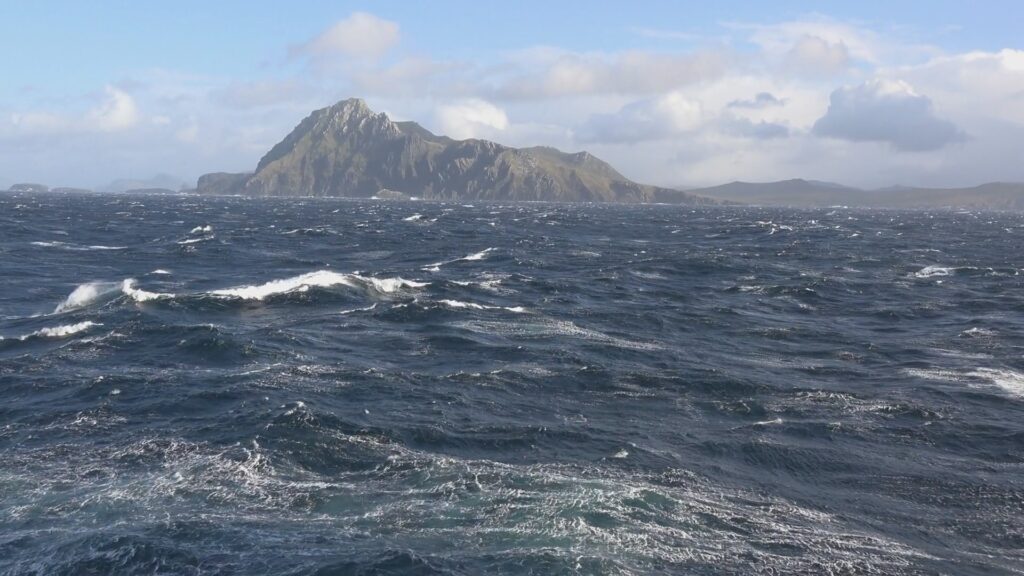
Cape Horn, at the tip of South America, has a type of Tundra where summer temperatures barely reach 10°C, but unlike the Arctic Tundra, has no winter frosts
In the uplands of Iceland and Norway, and at high altitudes in the Alps and Himalayas, summer temperatures are so cold, that tree growth is not possible, and so these areas have a form of tundra as Alpine meadows, although no permafrost exists here.
The southern tip of South America, and the coasts of the Antarctic peninsula also have tundra-like conditions, but without permafrost. These areas, however, are really slightly colder versions of the sub-polar Oceanic climate (the Koppen Cfc) that we talked about in Chapter 7, because winter temperatures here rarely fall below freezing, despite summer temperatures staying below 10°C, due to the heavy moderating influence of the Southern Ocean.
Landscapes and Vegetation So what landscapes and vegetation do we find in the Arctic? The absence of trees leads to stark vistas of empty plains and bare mountains, covered only by hardy low-lying grasses, moss, lichen, and low-lying shrubs, the latter occurring in the warmer section of the tundra bordering on the taiga.
The permafrost – permanently frozen ground from a few inches to a few feet below the surface in summer and going down to depths of up to hundreds of metres, not only inhibits plant root growth, but also prevents drainage, resulting in a patchwork of lakes, bogs and swamps in flat areas.
Notable settlements with the Tundra climate
Due to the short summer, the growing season lasts only for about two months, so the hardy plants that live here must flower as soon as possible after the long freezing winter.
Farming in such a harsh climate is non-existent – the few people that live in these regions, such as the Inuit of North America, rely upon the hunting of animals – seals, caribou, whales, fish, and even polar bears, among others, to feed themselves.
There are no major cities to be found in these regions – the largest settlement being Nuuk (formerly Godthaab), the capital of Greenland, with around 18,000 population.
Coursework Questions
Why can’t trees grow in the Tundra?
How does the Tundra climate differ from the Subarctic? Why are the tundra winters sometimes not as severe compared to the subarctic?
What is the permafrost and how does it influence the landscape?
What are the natural biomes and landscapes in these climate zones?
List out some regions that experience the Tundra climate.
Scenes from another world, surely? No towns or cities. No greenery. Almost no life at all. Virtually all of the world’s fresh water is here, locked up in ice sheets over a mile in thickness.
The harshest of all climates, these lands rarely see temperatures above freezing, and have the lowest on record anywhere on our planet. A land of ice, snow, glaciers, freezing winds and bitter cold. This is the icecap.
The Icecap climate is only found in any quantity in Greenland and Antarctica
Description and Dynamics
In our series looking at climate zones from equator to pole, we have at last reached journey’s end, and the finale is anything if not dramatic, because it is here, in the most northerly and southerly landmasses of Greenland and Antarctica, that we find the most extreme of all climates, what is known by climatologists as the Icecap.
The climatic definition of Icecap is simple. Average temperatures never rise above freezing. The consequence of this will seem obvious. There is no rain, no running water, just snow, usually blowing in from warmer regions around it, which builds up over thousands, even millions of years into an ice sheet a mile deep or more, meaning the surface of the ice is high above sea level, ensuring even lower temperatures and further guaranteeing the icecap’s survival. This process of thickening cannot go on indefinitely, of course, gravity demands that the ice be pulled down to the sea, and as a large mass, over enough time, the seemingly solid ice acts like a liquid, flowing toward the sea as glaciers. When these glaciers reach the coast, then break off into ice bergs, to eventually melt back into the ocean.
The icesheets of Greenland and Antarctica have built up over thousands of years of snowfall to several kilometers in thickness, resulting in even colder temperatures at the surface
Over decades, the ice ‘flows’ like a river from the icesheet down to the coast as glaciers
In the highest mountains of Earth, there are places where the temperature never rises above freezing point, and so glaciers form here, in the Rockies, the Alps, the Caucasus, the Himalayas and the Andes. But by land area and amount of ice held, these areas are insignificant compared to the two major ice sheets of the world – Greenland and Antarctica. Despite qualifying under the temperature requirements, for the purposes of climate classification, the Arctic around the North Pole is not usually included in the icecap climate, since there is no actual land there, just frozen sea ice up to several metres thick at most.
The Antarctic icesheet is about ten times the size of Greenland’s
Between them, Greenland and Antarctica account for 99% of the world’s fresh water, with the vast majority of that share being in Antarctica. The Antarctic ice sheet is almost ten times the size of Greenland’s, taking up an area equivalent to the United States and Mexico combined. If all of this ice was to melt, the sea level globally would rise by between 60 and 70 metres (approx. 200 feet).
Greenland
In the case of Greenland, it’s at first not clear why this land is covered in ice, when the surrounding islands are tundra. But unlike the surrounding lands, a wall of high mountains makes up what is believed to be a giant set of three islands. Millions of years ago, an ice age would have blanketed the whole area in a mile-thick ice sheet, but as the ice age retreated, it is believed the mountains prevented this ice from escaping quickly, and the high altitude of the ice cap maintained the very low temperatures necessary to preserve its survival into the present day.
On the western coast of Greenland, there are a number of gaps in the mountains where the ice flows out glacially, and on reaching the sea, these break off into icebergs which flow down into the North Atlantic. The ice berg that sank the Titanic began its life many thousands of years ago as snow falling on the ice sheet that covers the world’s largest island.
Antarctica
In the case of Antarctica, there are multiple reasons why this giant continent stays covered in ice, and why it is the coldest place on our planet. The first is obvious – it sits right over the south pole. In summer, sunlight strikes the earth here at an oblique angle, providing little warmth, and most of what sunlight does arrive here is reflected back from the blinding white ice. In winter, the sun remains below the horizon for months at a time, with consequently no chance of any input of heat.
In summer, the sun is very low on the horizon, and much of this weak sunlight’s energy is reflected back into space by the white of the icesheet
In winter, the sun is below the horizon for months at a time, providing no warmth at all
Secondly, Antarctica is surrounded by the unbroken Southern Ocean, allowing the prevailing westerlies and the circumpolar ocean current at these latitudes uninterrupted travel, preventing any movement of tropical air or warm ocean currents into the Antarctic region.
Lastly, Antarctica has had millions of years to build up its ice sheet, with the result that most of the continent’s surface of ice is above 2000m (6500?ft) in altitude, keeping temperatures even lower than they would be at sea level.
The Circumpolar Current prevents any warmth from more temperate seas penetrating Antarctica
Antarctic sea ice extent in summer
Antarctic sea ice extent in winter
In terms of seasons, temperatures in Antarctica stay below zero throughout the year, but the continent “grows” and “shrinks” in terms of area with the summer and winter, as sea ice melts and freezes over. During winter, only the extreme north of the Antarctic peninsula is directly accessible by sea, with all other coasts blocked by frozen ocean.
Hurricane force ‘Katabatic’ winds regularly strike out from the centre to the coasts of Antarctica
Winds and Precipitation
In both Greenland and Antarctica, these high altitude ice sheets produce a special phenomenon whereby the cold mass of air above the ice sheet seeks to fall into warmer air at the coasts, since cold air is more dense than warm. This leads to near constant winds, known as Katabatic winds, flowing out from the centre of these land masses to the sea, sometimes reaching hurricane strength. As if these places weren’t grim enough already.
In relative terms, despite the abundance of fresh water locked up the ice, this climate zone is technically a desert, with most places experiencing less than 250mm of precipitation per year (rain equivalent, not snowfall). This is because the air is so cold that it can carry very little moisture. Most of the snow that forms on the great ice sheets of Greenland and Antarctica blows in from either adjoining tundra regions, or relatively warmer marginal icecap areas near the coasts. In places in Antarctica, this combination of low precipitation and high winds causes certain dry valleys to be scoured of all ice and snow. In other parts, snowfall has never been recorded or suspected, suggesting that there hasn’t been precipitation in centuries or possibly millenia. This would make these places even drier than the Atacama desert in South America, which is otherwise regarded as the driest on our planet.
Is there any life in the Icecap?
Since average temperatures never rise above freezing, plant growth is impossible, and in any case, the ground is covered with a moving layer of ice. In some parts of the periphery of the ice sheets, moss and lichen grow on sunward facing rocks, but this is the limit of any vegetation. Despite this, however, a very famous set of animals have made Antarctica their home – these little fellas, and these… big fellas… Some species of penguins live in the Antarctic for the simple reason that there are no other species here – no predators to interrupt their breeding cycles. With the waters surrounding the continent being rich in fish, there is plenty of food to sustain sometimes gigantic colonies, and these conditions seem to be worth paying the price of living in the most inhospitable region on earth.
Human Settlement – Research Stations
McMurdo Station on the coast of Antarctica is the largest base on the continent. Image courtesy of Gaelen Marsden
Human settlement is confined to research stations on both the Greenland ice sheet, and in Antarctica. The largest of these is McMurdo station on the coast of the Ross Sea in Antarctica, which is accessible by ship in summer time, and among other functions acts as a supply base for other research stations on the continent.
Then there is the Amundsen-Scott South Pole station, at the geographic bottom of our planet. But this is not the coldest place on earth.
A sampling of climate data from Antarctic research stations
The official lowest recorded temperature at a surface based weather station occurred at the Russian Vostok research station in East Antarctica. On 21 Jul 1983, a temperature of -89.2°C (-128.°F) was recorded.
More recently, satellites recorded a temperature at the surface near Dome Argus, a snow dome which is the highest part of Antarctica at an altitude of 4093m, and on top of an ice sheet estimated to be at least 3km deep. The temperature observed by the satellite (on 10 August, 2010) was -93.2°C (-135.8°F). Compare this with the average surface temperature of Mars, of -63°C, and you can see why the icecap is the most other-worldly of all of Earth’s climate zones.
Coursework Questions
What is the simple temperature range definition of the Icecap climate?
How does year-round freezing temperatures affect the overall landscape in the Icecap climate?
What are the two main places in which the Icecap climate exists? How do they compare in size?
List the three reasons as to why Antarctica is so much colder than anywhere else on Earth.
What are Katabatic Winds?
Is there any life in the Icecap climate? If so, describe.
Is Antarctica colder than Mars? Discuss.
This was the last chapter. This is the end of the course. Visit our YouTube channel for more videos.
What Is the Köppen Climate Classification System? Global Zones Made Simple
What Is the Köppen System and Why It Matters
The Köppen Climate Classification System is a globally recognized method for categorizing different climate types. It uses two basic measurements: average temperature and average precipitation. By analyzing these, the system groups Earth’s climates into clear, understandable categories.
This framework was first introduced by Wladimir Köppen, a German climatologist, and later refined by Rudolf Geiger. Together, they transformed a complex set of climate data into a practical tool. Today, it’s widely used in education, agriculture, urban planning, and climate science.
What makes the Köppen system so powerful is its balance between scientific precision and usability. It offers a quick way to understand global weather patterns without needing complex tools. Whether you are a student, researcher, or policymaker, the Köppen system gives you an easy way to interpret climate data and apply it to real-world problems.
Why We Classify Climate: Purpose and Benefits
Classifying climates serves many purposes. Humans have always tried to categorize nature—from plants and animals to minerals and landscapes. When we classify climate, we turn weather patterns into something organized and predictable.
This system helps us make informed decisions. For example, farmers use it to choose crops suited to their region. City planners use it to design buildings that withstand local weather. Scientists study it to track climate change over time.
But there’s more than just practical value. Classifying climate zones also helps us understand how climate affects culture, biodiversity, and even human migration. By comparing different climate regions, we can appreciate how environments shape societies and ecosystems in unique ways.
Global Climate Zones from Equator to Poles
The Köppen system divides the world into five major climate groups, labeled with the letters A through E. These categories reflect the global pattern of temperature and precipitation from the equator to the poles.
Each group is broken down into subtypes, which add detail by describing seasonal rainfall patterns and temperature differences. This results in letter combinations like Csa or Dfb, which at first seem complex but actually provide a compact summary of a region’s climate.
By learning the meaning behind each letter, you can quickly identify what kind of weather to expect in any part of the world. This structure makes the Köppen system both easy to use and widely applicable in fields like education, meteorology, and environmental planning.
Group A: Tropical Climates
Tropical climates are found near the equator, where temperatures stay high throughout the year. These regions also receive abundant rainfall, supporting lush vegetation and rich biodiversity.
Af (Tropical rainforest): These areas experience heavy rainfall every month. The climate supports dense forests with tall trees, vines, and a variety of wildlife.
Am (Tropical monsoon): This subtype has a short dry season followed by intense rain. Monsoons dramatically affect agriculture and daily life in these regions.
Aw/As (Tropical savanna): Here, rainfall is seasonal. Wet and dry periods alternate, leading to landscapes with a mix of grasslands and scattered trees.
Tropical regions are often home to high population densities due to their fertile land and predictable seasons. However, they’re also vulnerable to flooding and drought, depending on yearly climate fluctuations.
Group B: Dry Climates
Dry climates are defined by a lack of rainfall. In these zones, evaporation exceeds precipitation, making water a scarce and precious resource.
BWh (Hot desert): Found in places like the Sahara, these areas are extremely hot during the day and cold at night. The landscape is mostly bare, with little vegetation.
BWk (Cold desert): These regions are dry but colder, often located at high elevations or inland. They have more seasonal variation and occasional winter frost.
BSh/BSk (Semi-arid): These areas receive slightly more rain, allowing for grasses and small shrubs to survive. They often serve as transition zones between deserts and more temperate areas.
People living in dry climates often rely on irrigation, water conservation, and climate-adaptive crops. These adaptations show how societies can thrive even under challenging environmental conditions.
Group C: Temperate Climates
Temperate zones offer moderate weather with clearly defined seasons. These areas typically have warm summers and cool winters, with rainfall spread throughout the year or focused in certain seasons.
Csa/Csb (Mediterranean): These climates are known for dry summers and wet winters. Common in southern Europe and coastal California, they support crops like olives, grapes, and wheat.
Cfa (Humid subtropical): Found in places like the southeastern United States, this subtype has hot, humid summers and year-round rainfall. It supports dense forests and is ideal for agriculture.
Cfb/Cfc (Oceanic): These climates feature mild temperatures all year and frequent rain. Coastal regions in western Europe often have this climate, creating green, fertile landscapes.
Temperate zones are often densely populated due to their favorable living conditions, long growing seasons, and steady access to water.
Group D: Continental Climates
Continental climates occur inland, where the ocean’s moderating effect is absent. This results in more extreme seasonal changes—hot summers and very cold winters.
Dfa/Dfb: These climates feature year-round precipitation, with summers that range from warm to hot, and winters that can bring heavy snow and freezing temperatures.
Dfc/Dfd (Subarctic): Found in Canada and Siberia, these areas endure long, bitterly cold winters and short, mild summers. The vegetation is mainly coniferous forest.
Living in continental climates requires careful planning. Buildings need strong insulation, and people often grow crops during short summer windows and store food for the long winters.
Group E: Polar Climates
Polar climates are the coldest on Earth, with very low temperatures and little to no precipitation.
ET (Tundra): These regions have brief summers where temperatures rise just above freezing. Small plants like mosses and grasses grow during this window.
EF (Ice cap): Found in Antarctica and parts of Greenland, these areas remain below freezing all year. No vegetation survives, and life is extremely limited.
These climates are important to climate research because they are highly sensitive to global warming. Even small temperature increases can lead to melting ice and rising sea levels, impacting the entire planet.
How Köppen Codes Work: A Simple System With Big Value
Each Köppen code is like a shortcut that describes a region’s climate. The structure includes:
First letter (A–E): Main climate group
Second letter: Seasonal rainfall pattern
Third letter (optional): Temperature variation
For example:
Csa: Hot-summer Mediterranean climate
Dfb: Humid continental with warm summers and cold winters
These codes are useful because they condense complex data into an easy format. They’re used in textbooks, climate reports, and even weather apps to describe climates at a glance.
Real-World Uses: Why the Köppen System Still Matters
The Köppen system isn’t just for scientists—it has everyday applications. Teachers use it to explain global climates. Farmers use it to select the best crops. City planners refer to it when designing buildings suited for local weather.
As the climate changes, Köppen zones help track shifts in temperature and rainfall. For example, some areas once classified as temperate are becoming more dry. This has major implications for agriculture, biodiversity, and water management. By using this system, we can monitor trends, adapt to changes, and make informed decisions that benefit both people and the planet.
Conclusion
The Köppen Climate Classification System turns global weather into a clear, understandable structure. From tropical rainforests to polar ice caps, each code tells a story about temperature, rainfall, and life. Whether you’re studying geography or planning a city, this system gives you the tools to understand climate—and respond to it—with confidence.
The 2025 monsoon is shifting from southwest to northeast after one of the wettest seasons in years. Discover why it was so intense and what comes next...
When floods or other natural disasters occur, every minute matters. Today, rescue teams have eyes from above, using satellite imagery, drones, or helicopters. As a result, they get a clear picture of...
The Amazon Rainforest: Its Past, Present, and Future https://www.youtube.com/watch?v=OcI1FlQOu54 The Amazon Rainforest. Raw, wild and absolutely essential to life as we know it. It is one of the most...
The Pacific North West of the United States and Canada. A wonderland of nature. Epic scenery – breath-taking mountains, endless forests, windswept beaches, even volcanoes. And amazing cities that have influenced the wider world far beyond their isolated patch along the wild Pacific coast. And… it is somewhat well known for its weather too. Dominated by wet winter westerlies blowing in from the Pacific each year, its exposed coasts feature some of the highest rainfall in the world, and sport temperate rainforests.
So when I briefly touched on this region in my Secrets of World Climate Series in the Mediterranean chapter, it created some controversy. “No way that’s Mediterranean! It’s Oceanic, Maritime West Coast, like Britain and Ireland!” And, like so many others, I have to confess, I had thought the same before I did my research into that series. So I thought I should devote an article to the Curious Case of The Pacific Northwest Climate, in this, the first of the cases, in my Climate Casebook.
Location of the principal cities of the Pacific Northwest
So the wet winters of the Pacific NW are pretty well known. It’s also fairly well known that Vancouver has the mildest of all winters out of all the Canadian cities. But much fewer people know about the summers in this area.
Having lived, myself, for many years in the Mediterranean climate of Southern California and South Australia, and the Oceanic climate of Britain, I have a very strong understanding of these two climate zones borne of direct experience backed by my own research. Yes, it’s undoubtedly obvious to anyone who knows a little of geography, that those Mediterranean areas are significantly warmer than Britain, both in winter and summer. That’s one distinction. The other, still fairly well known distinction is that those Mediterranean areas have dry summers. For most of the years I lived there, I could remember most summers where it did not rain for 4, 5 or even 6 months at all. To go without rain for even one month in Britain at any time of year is unusual, which was what made the British summer of 2018, where it was sunny every day and without rain for two months, all the more remarkable.
Britain is famous for its rain, very much so, in fact. And because Seattle, Portland and Vancouver are too, and because they lie at a similar latitude facing west to an ocean, the assumption is that they must have the same climate. An assumption I also once made.
But the truth is that the Pacific NW climate is actually a hybrid of these two climates I have lived under. It has very similar winter and summer temperatures to England, but it has the wet winter and dry summer patterns of California. Oceanic temperatures meets Mediterranean rainfall patterns.
Compared to the dodgy summers of Britain, Pacific NW summers are consistently glorious affairs. Low rainfall and high sunshine hours are the norm.
Let’s start with temperature and rainfall by comparing the three main cities of the Pacific Northwest with those of Los Angeles and London. As can be seen, the Pacific NW has very similar temperatures to London, with Portland in the south being slightly warmer, and Vancouver in the north being slightly cooler. LA is hotter than all the others year round – no surprises there.
But when it comes to rainfall, here is where the eyebrows start to raise. All three Pacific Northwest cities experience less rain than London during the summer, but much heavier rain during the winter. London’s rain is consistent throughout the year, and incidentally is drier overall. London has the classic Oceanic year-round rain pattern, whereas the Pacific Northwest has distinctly wetter winters and drier summers, consistent with a Mediterranean climate like Los Angeles, albeit wetter.
Climate Graphs of Pacific Northwest cities in comparison to classic Oceanic London and Hot Summer Mediterranean Los Angeles
Comparison of sunshine hours
Equally telling is this graph comparing these same cities’ monthly sunshine hours. All three Pacific Northwest cities experience similarly low sunshine hours to London in winter, but in summer, clearer skies result in sunshine hours that are closer to that of Los Angeles, which is well known for being one of the sunniest cities in the world. In general we can see that there is a dramatic seasonal variation in sunshine in the Pacific Northwest, compared to the consistently sunny LA, and sadly rather dreary London.
This climate type was actually known to Vladimir Koppen, and he designated this type with the letters Csb – C for mild temperatures, s for dry summer, b for warm summer. It shares two letters with Los Angeles Csa, and two letters with London’s Cfb, and so, it really is a hybrid of the two.
The Pacific Northwest Climate is a hybrid of Oceanic and Hot Summer Mediterranean climates
A detailed map of Koppen zones in the region, courtesy of Adam Peterson
Mediterranean climate zones across the world include the Pacific Northwest
That’s not to say the whole region comes under this climate zone. Parts of the coast have so much rain, with some falling throughout the year, that they are in fact Oceanic, although with still a noticeable winter-summer rainfall contrast. Vancouver also fits this bill, and is on the border of Oceanic Cfb and Warm Summer Mediterranean Csb.
Ok, so the climate data doesn’t lie. The question is why does this only occur in the Pacific NW? Well, actually it does occur in a few other places of the world, such as northern Portugal, southern Chile and the coast between Adelaide and Melbourne in Australia. But these other areas are either relatively underpopulated or don’t have the global reach that the Pacific NW hubs do, so their stories of similar heavy winter rains yet warm dry and sunny summers have gone unnoticed, drowned out by the much larger and well known Csa zones of the classic Mediterranean.
Lashed by storm after storm from the Pacific in the winter, known locally as “The Pineapple Express”, the Cascade and Rocky Mountains further accentuate this rainfall from the west, dumping it on the coastal cities that lie on the western slopes. These same mountains blocks humid subtropical and continental air from bringing rains in the summer, influencing the Pacific NW high pressure to dominate the area during summer, guaranteeing relatively dry weather.
Winters see regular storms moving in off the Pacific Ocean bringing plenty of rain
In the summer, the Rockies prevent Humid Subtropical air from the east moving into the whole of the Western United States
High pressure dominates, bringing fine weather for most of the summer
And so we get very wet winters reminiscent of the Scottish and Irish coasts winter, but then summers almost as dry as those of California. It’s a bit schizoid, a cross-breed, a mongrel of a climate. But talk to the locals and they love it. Well, the summers at least. Opinion is still divided on the winters…
It’s the world’s largest weather system. Affecting almost half of the world’s population, its seasonal changes in winds and rain determine the cycles of nature and humankind, year after year. It is the story of the world’s largest continent, fighting with two oceans, played out in the atmosphere above. From the blistering heat of India, to the frigid north of Siberia, this is the Asian Monsoon.
No discussion of Earth’s climate can go without some mention of the largest single pattern of weather on the globe. Because the Asian Monsoon covers so many individual climate zones, there was no room to give it a good treatment in any of the various chapters that covered Asia in my Secrets of World Climate series. And so it gets an chapter of its own in my Climate Casebook.
Etymology
To begin our understanding of this enormous weather system, we should start at the beginning, and the word itself. Monsoon comes through Portuguese monção from the original Arabic word mawsim, which means “season / change in wind direction”. You see, the Asian Monsoon even affects Arabia, even though that change in wind direction results in nothing yielding rain. A monsoon is, in its simplest form, always a change in wind direction, but in the case of the Asian Monsoon, this change in wind direction occurs around the whole of one side of the world’s largest continent, producing a wet summer and dry winter across a huge area of Earth.
Winds in summer bring moist ocean winds and rain onto Asia
Winds in winter bring dry continental winds
Geographic Extent
Now those of you familiar with tropical climates will know something of wet and dry seasons, and how the trade winds of the tropics determine these. I covered this in my chapter on Tropical Wet and Dry Climates in my other series. They always occur within the tropics of Cancer and Capricorn, from 23°N to 23°C south. So wet and dry seasons related to changing wind direction are not unique to Asia. What makes the Asian Monsoon stand out are two things – the great intensity of the wet season in the Indian Subcontinent and the extension of the wet and dry season pattern in Eastern Asia way beyond the tropics into the temperate, continental and subarctic latitudes.
So the Asian Monsoon has these two notable aspects, and each defines the two broad halves of the monsoon.
The intense monsoon that affects India and Bangladesh is the most well known, and it determines the lives of the one and a half billion people that live there, more heavily than any other weather system in the world. The economic fortunes, even the survival itself, of these populations depends upon the timing and severity of the wet season that washes over these lands between June and September.
The two broad subdivisions of the Asian Monsoon
Less well known is the East Asian Monsoon. Though less intense, its range is much more extensive, and as many people experience its annual rhythm, with Eastern Russia, Mongolia, Korea, Japan, Taiwan and most of China affected.
Dynamics – The Annual Movement of the ITCZ
Before we look at these areas in more detail, we should try to understand what dynamics are special to the Asian Monsoon. This weather system and its causes are complex and even to this day are not fully understood. However it is generally accepted that the two strongest influences are the seasonal march of the doldrums above and below the equator that affects all tropical wet and dry climates, magnified by the seasonal heating and cooling of the giant Asian landmass.
The doldrums, also called the Intertropical Convergence Zone, or ITCZ, is the band of low pressure around the tropics where heating from the sun causes upward convection of hot air leading to a drawing in of air from the surrounding land or sea in the form of trade winds. As the global seasons alternate summer between the northern and southern hemispheres, the ITCZ follows, with it tracking north in the northern summer, and then south in the southern summer. This band is almost always accompanied by heavy thunderstorms and consequential rainfall as the hot and moist air is unstably thrust into the cold upper atmosphere.
The Doldrums (ITCZ) in July bring low pressure and storms to Asia
The Doldrums (ITCZ) and its storms are in the southern hemisphere in January so conditions in Asia are generally dry
Summer Monsoon
In the northern summer the ITCZ moves up into India and China, bringing with it southerly trade winds which blow onto the continent from the surrounding seas. This is what brings the rain with the monsoon, as it does with any tropical wet season. But this effect is strengthened further by the presence of the large Tibetan plateau, the heating of which leads to a deepening of the low pressure, strengthening the monsoon over India far beyond a standard tropical wet season.
Additional summer heating of the central Asian land mass north of Tibet, far from the moderating ocean, is also strong, and extends as far as Siberia, leading to winds blowing in from the Pacific across all of Eastern Asia from Hong Kong to the Russian Pacific coast. This is the only part of the world where summer peaks in rainfall occur in the mid to high latitudes and special climate zones, the Continental and Subarctic Monsoon types, were designated by Vladimir Koppen to account for this extension into the far north of what is essentially a tropical weather system.
In July, intense low pressure over the Tibetan plateau exists, further intensifying the pull of air off the Indian Ocean
The monsoon’s incredible reach, as seen in graphs of northern inland cities
The Asian Monsoon should not be confused with the Koppen Climate Zone ‘Tropical Monsoon’, which occurs throughout the tropics
The Asian Monsoon should not be confused with the Koppen Climate Zone ‘Tropical Monsoon’, which occurs throughout the tropics
Monsoon type climate zones extend way beyond the tropics into subarctic regions
Koppen Climate Zones, Winter Monsoon, Effect of Australia and Ocean Pressure Zones
While we’re on the subject of Koppen, we shouldn’t confuse the Koppen Climate type Am – the Tropical Monsoon, with the Asian Monsoon, as this zone can occur all over the tropics, from Miami and Rio in the Americas, to Central Africa, Indonesia and the Philippines. The Asian Monsoon encompasses a multitude of Koppen Climate zones, all of which have peak rainfall during the summer. These are Am – Tropical Monsoon, Aw – Tropical Savannah, Cwa – Subtropical Monsoon, Cwb – Subtropical Highland, Dwa/Dwb – Continental Monsoon, and Dwc/Dwd – Subarctic Monsoon.
So that is summer. But what about winter? Well, the opposite occurs. The ITCZ retreats back to below the equator while temperatures over Central Asia plummet below zero, leading to sinking, dense air and high pressure. This high pressure is the strongest on Earth and the continental winds that blow out from it to the oceans lead to dry winters across most of Asia. Only a few places, where such seasonal monsoon winds blow over water in both directions, receive rain or snow year round.
Extremely cold temperatures over Siberia in winter lead to sinking air…
… and very high pressure
So this, in essence, is the main mechanism driving the Asian Monsoon. There is more complexity to it of course. Australia is believed to have a strong influence on Asia, even though it is much smaller, because it acts as a pressure “counter-pole” – with Australian high pressure in the northern summer against the Asian low, and vice versa six months later. The Indian and Western Pacific oceans are the other “counter-poles” that either provide moist winds in the form of high pressure, or sink dry continental winds in the form of low pressure.
Low pressure over Australia…
… and the Indian and Pacific Oceans in January act as counterpoles to Asian high pressure and intensifying winds blowing out of the continent
High pressure over Australia…
… and the Indian and Pacific Oceans in July drive moist winds and heavy rain onto Asia
The monsoon’s growth in summer and retreat in winter can be seen in this composite of monthly average rainfall across the continent. It’s quite a mesmerizing animation, isn’t it? I could watch it for hours… Ok, moving on. Let’s now journey through the lands affected by the monsoon and examine how local topography and other factors leads to particular effects from one region to another.
Average rainfall throughout the month of January is low…
… compared to the deluge in summer
Arabia
The journey starts in the Arabian peninsula, with the origin of the word itself, but it’s also the westernmost point under the direct monsoon influence. In summer, winds blow towards the intense low pressure over Central Asia, but because these winds have travelled over the continent of Africa, they bring little to no rain. In winter, the winds switch direction, blowing out from the central Asian high, and once again are dry, continental winds. This is one reason why the Arabian peninsula is a desert.
Wind directions in Arabia in both January…
… and July come off the land and so are dry, leading to desert
Indian Subcontinent
Moving east into India, and the same wind directions, SW in summer, NE in winter, produces a dramatically different result. Now the SW summer winds blow over the warm Arabian Sea throughout the summer months, bringing in storm after storm that lashes the western coast of India from Kerala in the south to Gujarat in the north. All along this coast sits one edge of the Deccan plateau, and these moist winds are pushed upward and cooled, releasing their moisture in spectacular fashion as this graph of Mumbai shows.
The monsoon progresses across the Indian Subcontinent in stages, with the south receiving rains as early as late May, and the north as late as mid-July. Protected somewhat by the Deccan, much of the country experiences less severe monsoon rain. But where these strong, moisture-laden winds hit the Himalayas, they are thrust upward in a similar fashion to the west coast and dump almost all their moisture on the windward slopes. And with this mechanism, known as orographic lift, we come to a global superlative. The Indian Monsoon produces the wettest places in the world.
In July, ocean storms lash the Western coast of India bringing torrential rain
The arrival of the Indian Monsoon begins in the south as early as April…
… and heads north into May…
… and further again in June…
… until the whole subcontinent is wet by July
Being further inland, Delhi receives significantly less rain than Mumbai
Mawsynram and Cherrapunji, both in the Indian state of Meghalaya lie in the foothills of the Eastern Himalayas, and the world’s wettest title alternates from year to year between these two towns. Here’s the graph of Cherrapunji, with the scale kept at the standard used for all my charts, just so you can get your head around how much rain falls here. In one month alone at the peak of the summer monsoon, more rain falls here than in an entire year in Singapore, in the heart of the wet Tropical Rainforest, three times more rain than the annual total in rainy Vancouver, and six times more than the annual amount in supposedly rainy London. Such is the power of the monsoon.
‘Orographic Lift’ is the mechanism by which rain is produced from the uplift of air over terrain
The two rainiest places on Earth are in India, just north of Bangladesh
The summer rainfall of Cherrapunji is just mindboggling… and the annual total dwarfs other notably wet world cities
This graph of Lhasa in Tibet shows the effect of the Himalayas. Being sheltered from the full brunt of the monsoon behind the highest peaks of those mountains, including Everest, comparatively little rain gets through, although the mark of the monsoon is still clearly visible in the difference between winter and summer.
In the Indian winter, the dry NE wind blows from Central Asia out into the Indian Ocean, leading to completely dry conditions for months at a time, first with cool temperatures, and then very hot temperatures, which leads to the unique three seasons pattern of much of that country. A hot and wet rainy season, warm and dry “winter”, then very hot and dry “summer”.
Lhasa, behind the highest peaks of the Himalayas, experiences significantly less rain than India
In winter, dry winds blow across India from the heart of the continent
Such is the power of the monsoon, that changing wind directions changes the direction of ocean currents
Such is the strength and consistency of the seasonal monsoon winds, that they are even able to change the direction of an ocean current. A current’s direction is primarily determined by the winds blowing over it, so in summer, the around India flows east from Arabia to Myanmar, and in winter it flows west. So the name of this current alternates between the SW Monsoon Drift and the NE Monsoon Drift. This is the only major ocean current where such a reversal occurs every year. Such is the power of the monsoon.
China & Korea
Continuing further east, and we pass over South-East Asia. This area does feel the influence of the monsoon, but is within the normal latitudes where tropical wet and dry seasons occur, with Koppen types Am and Aw predominating, so does not require special mention in this article.
As we continue north and east, however, we enter Southern China, and the beginning of the Eastern Asian Monsoon. The interplay between continent and ocean now switches to the Pacific, and so we get a different character to that of the Indian – less intense, but spread out over a much greater area. The monsoon pushes inland hundreds of miles into the heart of China, subtropical in the south, continental in the north, and as one travels further north, the amount of rain, and the number of months in which it falls reduces, as the Pacific moisture is lost over the land carried by southerly winds.
Beijing, much further north than Hong Kong, is further from the ocean in terms of the summer monsoon winds, so sees much less rain
Seoul, South Korea, experiences a marked summer peak in rainfall as monsoon winds blow in from the south
Korea, like Northern China experiences the monsoon as a continental climate, with dry and cold winters blowing in from the Siberian High. But, being on the coast, the monsoon brings very wet summers, as this graph of Seoul shows.
Japan
Because Japan is an island archipelago, the change in wind direction produces rain or snow across all seasons, blowing in from the Pacific in summer and in winter, across the Sea of Japan that lies between this country and Russia. So one gets a more even distribution of precipitation across the year throughout the islands, although along this mountainous set of islands, the main population centres along the east and southern coasts experience summer rainfall peaks, while the north and west facing coasts get noticeable winter peaks, usually in the form of snow. In fact Sapporo, the largest city on the northern island of Hokkaido, is the snowiest city in the world, thanks to the winter monsoon winds.
Because of the Sea of Japan, the seasonal reversal of monsoon winds bring rain in Summer and Snow in Winter
Sapporo receives deluges of snow in winter, while Tokyo, on the southern side of mountains, sees a summer rainfall peak
Typhoons in East Asia are another distinction between this part of the monsoon and that of the Indian part. These often ferocious storms account for a considerable proportion of total rainfall in the season as they lash cities from Taiwan and Hong Kong in the South to Japan in the north.
Siberia & Conclusion
The East Asian Monsoon’s influence reaches its end in the far north of Eastern Siberia, where the influence of the winter Siberian High leads to very dry winters. In summer, southerly monsoon winds still penetrate this vast area, bringing rain, but by this stage, are weakened considerably and the amounts are little compared to those further south. Still it is a remarkable fact that a singly connected weather system can affect such a large area, across so many lines of latitude, from 20°N in India, through to 70°N in Siberia. Such is the power of the monsoon.
The deep Siberian High Pressure zone is responsible for the entire Asian monsoon winter pattern
Even Irkutsk, in the subarctic of Siberia, feels the influence of summer monsoon rains
The Asian Monsoon varies in intensity from one year to another, affecting both India and China, so these average rainfall graphs, as always, can be deceptive in hiding the true pattern of annual variability. Too little rain, and effective drought can occur, since the rest of the year in many places is very dry already. Too much rain, and flooding occurs across large areas, in addition to landslides along the southern and eastern edges of the Himalayas. Too little and too much rain can lead to many thousands of deaths in this way. The monsoon is a taker as well as a bringer of life.
For hundreds of millions of years they have they have defined the rhythm of nature on our planet. They underpin the daily existence of billions of us today. A product of the clockwork of the heavens. These are the seasons of Planet Earth.
Astronomical Origins
When talking about climate, one cannot ignore the concept of the seasons. It’s the variation in temperature and precipitation throughout the year that defines each climate zone on our planet. Each zone has a unique combination of seasonal patterns. And these patterns determine the biome – the characteristic of vegetation – of the land in that zone, what agriculture can be sustained there, and ultimately whether it can support human population.
But what are the seasons? What is their origin? Why do they always repeat year after year? Why are they different in the tropics than in the higher latitudes? Why do they reverse in the southern hemisphere?
All these questions are answered in the relationship between our planet and its parent star – the sun.
When a planet orbits a star, it traces an elliptical path that is always in the same horizontal plane – the orbital plane. But the planet itself will rotate on its own axis at some other angle – what is known as axial tilt. The result of this is that as the planet moves around the star, the angle at which the star’s light strikes any particular point on that planet will change. As surface and atmospheric heating is directly related to the angle of the star’s light, the position of the orbit will therefore influence temperature for that region of the planet. So every planet in the galaxy with an atmosphere will have some combination of seasons, and so the phenomenon shouldn’t be thought of as unique to our planet. In fact the planets Mars, Saturn, Uranus, and Neptune and Saturn’s moon Titan all have distinct seasons that have been observed.
Axial Tilt is the angle around which a planet rotates about its axis compared with its orbital plane around its parent star
In summer rays from the parent star hit the ground at a steep angle, producing a large heating effect
In winter rays from the parent star hit the ground at the same spot at a shallower angle, producing a smaller heating effect
Every planet in the universe with an atmosphere that orbits a star will have seasons
There are four significant points in any planet’s orbit in this regard – the first two being when each of the planet’s poles is pointing closest toward the star, and the second two being when the poles are exactly at right angles to the star.
In the case of our planet, our axial tilt is just over 23°. So on the day when the North Pole is facing closest toward the sun, June 21st to be precise, every point on a line encircling the earth 23° north of the equator will experience a midday sun that is exactly overhead. This is midsummer in the northern hemisphere, when heating from sunlight is at its greatest.
Exactly 6 months later, on December 21st, when the South Pole is facing closest toward the sun, every point on Earth 23° south of the equator will have a noonday sun overhead. This is midsummer in the southern hemisphere.
These two lines are respectively the Tropics of Cancer and Capricorn, called such because the sun is in those zodiac constellations on those special days, which are known as the summer and winter solstices. The word solstice comes from Latin [sol + stit], meaning “sun stationary”, and literally describes the stop and reversal of the sun’s highest or lowest daily point in its seasonal progression.
Exactly in between the solstices, on March 21 and September 21, the Earth’s poles are at an exact right angle to the sun, which means that on these days, the sun at noon at the equator is directly overhead. These days are called equinoxes – from the Latin [aequus + nox], meaning “equal night”. The hours of day and night across every point on earth are the same at 12 hours each on these special days.
Earth has an Axial Tilt of just over 23°
The Tropic of Cancer is that line around the earth at just over 23°N that sees the sun at the zenith at noon on June 21st
The Tropic of Capricorn is that line around the earth at just over 23°S that sees the sun at the zenith at noon on December 21st
At the equator, the sun is at the zenith at noon on March 21st and September 21st
In practice, midsummer temperature peaks lag behind midsummers day by a month or so – most will experience that July and August are the hottest months in the Northern Hemisphere, and not June. And the same goes for winter, with January and February being the coldest, and not December. This is called “seasonal lag” and occurs because it takes time for the earth and oceans particularly to warm up in that area.
This cycle repeats itself near-exactly, year in year out, because the Earth returns back to the same point exactly one year later, as regular as clockwork (if human-made clocks could ever be so precise). I say near exactly, because the Earth is in fact wobbling by a few degrees on its axis, in the same way a spinning top might wobble. But this wobble has a cycle of almost 26 thousand years, so… you’re not going to notice anything in your lifetime.
Peak temperatures lag a month or so behind the summer solstice due to slow oceanic heating
While the current axial tilt of the Earth is 23.4° it will cycle over a very long period between 22° and 24.5°
Atmosphere
Ok, so that explains the origin of the seasons, but the effects of this on daily weather depend upon whether you live inside or outside of the Tropics of Cancer and Capricorn. Within the Tropics, the changes in the angle of sunlight from one solstice to the other has little or no influence on surface heating and so the tropics see very little change in temperatures across the year.
Seasons in the tropics are in fact determined by the presence or absence of rain. When the sun is at right angles to the earth, heating is at its greatest, leading to thermals of hot moist air, which, when rising into the upper atmosphere, cool, losing their moisture, and depositing rain in the form of thunderstorms. As the sun tracks back and forth across the equator throughout the year, this band of rain follows it. This band is called the doldrums, or Inter-Tropical Convergence Zone (ITCZ), as it is the convergence of tropical winds, known as trade winds, being sucked into it from surrounding areas. When these winds carry moisture, they also bring rain, and so this complex pattern determines what areas will be wet or dry during what season. Only where the ITCZ is stable, or where trade winds carry moisture regardless of direction do we have the Tropical Rainforest, where rainfall and temperature are near constant – the only climate on earth without seasons.
In July, the ITCZ, with its accompanying thunderstorms, is north of the equator and brings the wet season to the northern tropics
In January, the ITCZ, with its accompanying thunderstorms, is south of the equator and brings the wet season to the southern tropics
Outside the tropics though, these sunlight angles become important. If you know anything about trigonometry, then you’ll get the idea that as the angle of sunlight to the surface becomes shallower, there is an acceleration of the effect of that heat spreading out across the surface and being diluted in power. So that by the time you reach the poles, the heating effect of the sunlight is only a tiny fraction of what it is at the equator.
A shallower sun angle means the heat from the sun is spread over a wider area, diluting its power, and reducing heating effect
The angle of the sun varies little in the tropics, and so temperatures changes between summer and winter are small
At the mid latitudes, the change in sun angle between winter and summer is much greater, leading to bigger temperature changes
In the mid latitudes, the change in seasonal angles is significant enough to produce large changes in temperature. In summer the sun is high above the horizon, concentrating heat and delivering warm or hot days. In winter, it’s much closer to the horizon and so surface heating is much less, with the result of significantly colder days.
This variation in temperature in the mid-latitudes is diluted, however, by the proximity of oceans. Being a large fluid mass, kilometres deep, the oceans do not heat as much in summer as the land, and do not cool as much in winter. So land areas near an ocean have much smaller winter/summer temperature ranges than those in a continental interior. This difference in coastal and interior continental temperatures is at its greatest in the mid-latitudes and is the essence of why we have more climate types in this region of earth than any other.
Proximity to oceans has a moderating influence on seasonal temperature changes
The tropics see little seasonal change between day and night duration, while polar regions see huge changes
In the polar regions, the effect of axial tilt is at its extreme. Above the polar circle at 67°N, there is at least one day each winter when the sun does not even climb above the horizon, and at least one day each summer when the sun never sets. As one approaches the pole, these number of days increase until at the North Pole, the sun doesn’t rise for 6 months in winter, and stays above the horizon for 6 months in summer. The same occurs at the opposite time of year in Antarctica.
Global Seasons and Climate in One Chart
Seasonal Changes in Temperature and Precipitation by Climate Type
In the Koppen climate classification system, we have categorised patterns of temperature and rainfall determined by the seasons. You can learn more about this in my intro article or by watching my Secrets of World Climate series which covers each zone in detail. What you almost certainly haven’t seen before, is a representation of seasons across all Koppen zones in one image. And here it is.
For readability, I have grouped similar zones together or omitted rare or isolated ones. This list shows the most important and distinct zones, starting at the equator at the top and finishing at the pole at the bottom of the page. For each zone I have depicted the change in temperature across the year in a colour spectrum, from red as the hottest to purple as the coldest. Below each temperature progression is a progression of precipitation, with rain in blue, snow in white, and intensity of such precipitation as proportional shading. These patterns are for the northern hemisphere and will naturally be reversed for the southern.
Up top we see the unchanging single hot and wet season of the Tropical Rainforest. Next we see the change in rainfall across the year in the Tropical Monsoon and Savannah climates, and a slight bump in temperature just before the wet season.
After this we see the unique Subtropical Highland climate, where temperatures are reduced due to altitude. Note that there is a form of this climate where the rain is constant year round, but is not shown here.
Then we come to the Hot Desert, where there is little to no rain, but intensely hot conditions in summer.
We then have the unique three season climate of the Subtropical Monsoon – a mild dry winter, then a short and very hot dry summer, followed by hot wet season.
As we move into the mid latitudes, we get our first cool winter temperatures in the Humid Subtropical, followed by the unique dry summer /wet winter pattern of the Mediterranean climate zones. This latter, together with its westerly ocean facing sibling, the Oceanic, demonstrate mild temperature ranges from winter to summer.
By contrast the Continental climate zones that follow show much more extreme temperature ranges, with subdivisions of these being the cool deserts, with absence of rain, Humid Continental, where we see snow and rain defining seasonal precipitation and Continental Monsoon, where this pattern is varied by an absence of winter precipitation. The final continental climate of the Subarctic is then seen with extreme temperature ranges featuring very cold winters yet warm summers.
As we reach the poles, freezing temperatures dominate with only a brief cool summer in the tundra bringing any respite to these forbidding lands.
Humans. They are an interesting species aren’t they? At the time of this production, there are estimated to be 7.7 billion of them roaming around the surface, and that figure is still rising.
There are many reasons why people live in the places that they do. On the coast, or along rivers, for trade. Security in the hills, away from invaders. Occasionally, rulers arbitrarily create new capitals in the centre of their realms.
But the main determinant for human settlement is the availability of clean, fresh water. Because without it, crops cannot grow, livestock cannot be raised. Without those, there is no food. Without food, there is no population.
And what determines the availability of running water? Rainfall and temperature. Too little rain, and you have a desert. Too cold, and you have frozen ground, ice. Too much rain and heat, and you could have disease.
So climate and population are inextricably linked. And if you know a bit about climate classification, then you’ve probably wondered which climate types have the least and most populations. Well it’s time to wonder no more, because after extensive original research and tabulation this data is about to be presented, in this the latest article in my Climate Casebook.
If you’ve viewed any of my other articles then you should be familiar with the Koppen climate system, which breaks down the world into zones of climate types based on temperature and rainfall patterns. If you haven’t, then I recommend you check out my Secrets of World Climate series, or for a quick overview, this summary article.
There are 29 Koppen zones in total, but I’ve grouped most of these into the twelve more distinct categories that formed each chapter in my Secrets of World Climate series. So, let’s get right into which climate zones support what populations. You’re probably wondering which zone has the biggest population, but to keep you in suspense, we’re going to go in reverse order, starting with the most empty of human life.
At number twelve there are no surprises for guessing that the least populated climate zone is the Icecap. Since temperatures never rise above freezing, no self-sustaining settlements are possible, and so research stations make up the “population” here. The number of scientists varies depending on the season with summer being higher than winter, and the vast majority of this population numbering in the thousands is in Antarctica with typically less than one hundred on the Greenland ice sheet at any given time.
Populations in the Tundra
At number eleven, we have the next coldest zone – that of the Tundra. In these bleak, treeless lands, agriculture is impossible, and any settlements here either have to rely on supplies from outside, or on hunting wildlife. Total tundra population worldwide is estimated to be in the hundreds of thousands – a tiny, tiny fraction of the total human population. These populations are scattered worldwide with about half spread along the coasts of the Arctic and the other half concentrated in the southern tip of South America. Some of you may take issue with the inclusion of Tierra del Fuego, since it’s not true tundra in that it does not experience very cold winters like the arctic, and is in fact a slightly cooler version of the Subpolar Oceanic variety where summer temperatures rarely exceed 10°C. But it would be an omission to not mention it.
At number ten, we have the next coldest zone – the vast subarctic band that spreads across northern North America, Europe and Asia. Now we are getting into the millions in terms of population, but still less than a fifth of one percent of humans live in the vast boreal forests that experience warm summers but very cold winters here. This population is mostly found in Russia, which is to be expected as it contains the largest land area under this climate type, including the vast stretches of Siberia. There are a number of Koppen subtypes in the Subarctic. Most people live in the standard Subarctic of cold winters and year round precipitation, with a smaller fraction in the east of Asia where only light snow falls in winter, with more consistent rain in summer. A much smaller fraction live in the area of very cold winters in north-east Siberia.
Subarctic population by countries
Subarctic population by climate sub-type
Populations in the Tropical Rainforest
At number nine, and we switch from the coldest zones to one of the hottest – the year round rain and warmth of the Tropical Rainforest. With a global population of just over a quarter billion, we are at last into an area that is home to a significant percentage of total human numbers. Almost half of them live in just one country – Indonesia, with most of the others also within SE Asia, and significantly fewer numbers in South America and Africa.
At number eight and we head to the mid-latitudes, and the western fringes of the continents under the sway of maritime westerly winds – the Oceanic, characterised by rain year round and relatively mild temperatures between winter and summer. Of the two hundred and seventy million souls living in this zone, the vast majority are within the densely populated and fertile lands of northwest Europe, with the three larger countries there accounting for almost three quarters of the global Oceanic population. There are two Koppen subtypes in the Oceanic – the standard and the subpolar variety, the latter of which experiences cooler summers and is akin to a perpetual autumn. With this description it’s perhaps not surprising that only a comparatively tiny number live in this sub-zone.
Oceanic population by countries
Oceanic population by climate sub-type
Onto number seven now, and with just over 300 million people, we’re back in the tropics, but this time at the cooler elevations of upland areas, providing year round spring like temperatures in the Subtropical Highland climate. Populations are split across all continents here, with high population countries with significant upland areas like Ethiopia, Mexico, China and Colombia topping this list. Koppen listed three different variants of this climate type. Two monsoon forms separated by warm or cool temperatures which both have wet and dry seasons, and an all year warm and wet form. The warm monsoon form dominates in terms of population. By the way, when you see the word “Humid” in climate classification, it is simply designating year round rain, and is not a comment on the clamminess of air.
Subtropical Highland population by countries
Subtropical Highland population by climate sub-type
Up to a third of a billion now as we reach number six and the cool deserts. In terms of population, Central Asia, with its vast continental deserts of hot summers and cold winters, dominates, with all but two countries in this list from that area. China’s contribution comes from its north-western dry region that is part of the central Asian desert area, while most of Iran’s large population lies in this climate zone due to the high elevation of that country that would otherwise have put it in the predominately hot desert Middle East. There are two Koppen subtypes here, the semi-arid steppe, and the true cool desert. Since the latter is one of the harshest climates on earth, it’s no surprise that the steppe dominates in terms of population.
Cool Desert population by countries
Cool Desert population by climate sub-type
At number five in our countdown toward the most populous climate zone, and we reach the Mediterranean, and the copies of its unique dry summer rainfall pattern across most continents, home to almost four hundred million people. But true to form, and the actual Mediterranean dominates the population list with only the extensive dry summer pattern of the western coast of the United States providing numbers to counter those of the populous countries with Mediterranean shorelines. There are two Koppen subtypes within this climate, separated by summer temperatures, and the “classic” Mediterranean Csa hot summer type dominates in terms of population as it does land area.
Mediterranean population by countries
Mediterranean population by climate sub-type
We step a gear in terms of population sizes now as we reach number four in our list, the Continental climate. Defined by big temperature ranges between summer and winter and plenty of rain and snow, these regions, which occur only in North America and Asia, are home to almost eight hundred million souls. China is the largest contributor here, with its densely populated north eastern region centred around its capital Beijing lying within the wet summer variants of this climate. Next is Russia, where the majority of that vast country’s population is housed on the rich and fertile plains of Eastern Europe, as Ukraine and Poland demonstrate also in this list. A significant chunk of the USA’s population is within this zone, and almost all of Canada’s. There are six different Koppen types here with the classic “Humid” form of year round precipitation and warm summers dominating population as it does land area. Almost all of the population of the “Monsoon” types are from China, with the remainder from Korea. The dry summer variants demonstrate their rarity in this chart, making up only a tiny fraction of the whole.
Continental population by countries
Continental population by climate sub-type
Onto number three now in our most populated climate zone list, and one of the biggest surprises. Close to one billion people on our planet live in hot desert or hot semi-arid conditions. The Indian Subcontinent dominates here, with the dry region of Western India and Pakistan being inhabited in great numbers in this generally highly populated part of the world. Common with Pakistan and two other countries on the list – Egypt and Iraq – is the presence of major rivers flowing through an otherwise completely barren region – the Nile in Egypt, the Indus in Pakistan and the Tigris/Euphrates in Iraq. These rivers provide for vast areas of irrigation, allowing huge bounties in crops in the ever-present sunshine. Other significant populations occur across the Sahel semi-arid region immediately south of the Sahara desert. In terms of Koppen climate types, the true desert and semi-arid forms are fairly evenly split in terms of population.
Hot Desert population by countries
Hot Desert population by climate sub-type
We’re now down to the final two – the two most populated climates on Earth. It was actually a close call in terms of the numbers. Both have enormous populations. If you’ve watched my other videos you’ll have heard clues about which ones they are, if you’ve not already worked them out now by a process of elimination.
Ok, so the second most highly populated region of earth is… The Tropical Wet and Dry zones – the Tropical Monsoon and Savannah. Spreading out across a vast swathe of the Tropics, and encompassing such well known populous nations as India, Indonesia, Nigeria, Bangladesh and Brazil, it’s no surprise that this climate type is topping out in terms of population. Two… billion… people, ladies and gentleman. That’s over one in four of all people on our planet. The reason for this is simple – the combination of all year round warmth and plenty of rain, albeit in a seasonal pattern, allows for bountiful crop harvests, often multiple times per year, feeding vast numbers. India, with its vast population in its southern half, makes up a full quarter of the total in this climate zone at half a billion alone. In the Koppen classification, the Monsoon and Savannah separate out the Tropical Wet and Dry climates, with the Monsoon being wetter with less distinct dry seasons than the Savannah. As the Savannah accounts for more land area than the Monsoon, it makes up the majority of population also.
Tropical Monsoon & Savannah population by countries
Tropical Monsoon & Savannah population by climate sub-type
And so we come to number one on our list. The climate zone with more people in it than any other. This is the subject of Chapter 5 in my Secrets of World Climate series, when at that time I mentioned its large populations and awarded it with the most number of major world cities than any other. Lying just beyond the tropics, and found on the easterly margins of every continent of earth, it is home to a whopping 2.2 billion people. It is defined by hot and wet summers, but comparatively cool winters… And unless you follow climate, you’ve probably never heard of it. It is the Humid Subtropical.
Humid Subtropical population by countries
Humid Subtropical population by climate sub-type
The vast population of China – almost two thirds of that country’s population are in this zone – a billion people! The equally vast population of India – a third of Indians live in this zone – half a billion again. And what about the United States? Over half of all Americans live in this zone – that was a surprise even to me. Almost ninety percent of Japanese live here in their overcrowded islands. It is probably the most culturally and geographically diverse of any climate zone.
Global Population by Climate Type
Something about this climate type allows it to support such vast populations. With plenty of rain, either throughout the year, or during the summer, there is plenty of water. But unlike the tropics, the winters are cool – perhaps this is the clue – in that tropical diseases are much less common here, allowing for healthier populations. It is unclear. But the population densities are higher here than in any other zone, on practically every continent.
The two subtypes are broken down by rainfall pattern, Cfa for year round rain, and Cwa for a summer monsoon peak. Interestingly they both contribute near equally to the huge population numbers at a billion each.
So, with our list complete, let’s now make a comparison of our twelve grouped zones, in our final graphic. This chart shows just how dominant the two largest climate types are, with over half the people in our planet living in them. The next quarter of our planet’s population live in the next two, while all other climate types fill out the remaining quarter. In some cases these differences in population score are a reflection of the relative land areas taken up by such zones – for instance Mediterranean zones occupy a much smaller land area than, say the Tropical Savannah. But in other cases, such as the subarctic, it can be seen that such vast areas support comparatively little population. This demonstrates that the most populous regions of earth are indeed a result of climates that offer plenty of clean, running water. It’s not really any more complex than that.